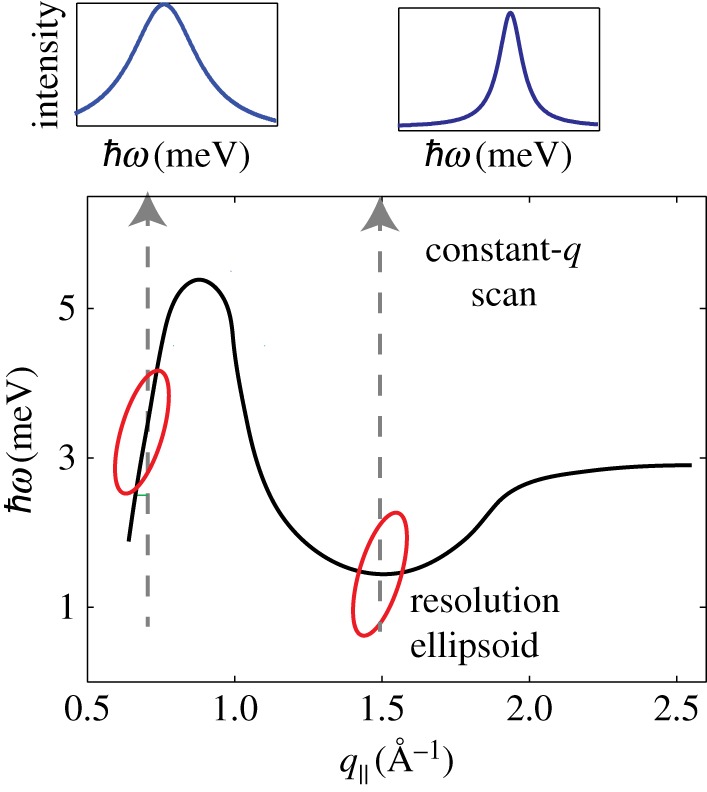
Figure 10.

Lipid dispersion and instrumental resolution. The lipid dispersion is drawn schematically. During a constant-q∥ scan, the resolution ellipsoid is moved across the dispersion to detect the corresponding excitations. The smallest peak width in the spectra is observed when the dispersion is cut perpendicular, in the minimum of the dispersion relation.
