
Figure 2.
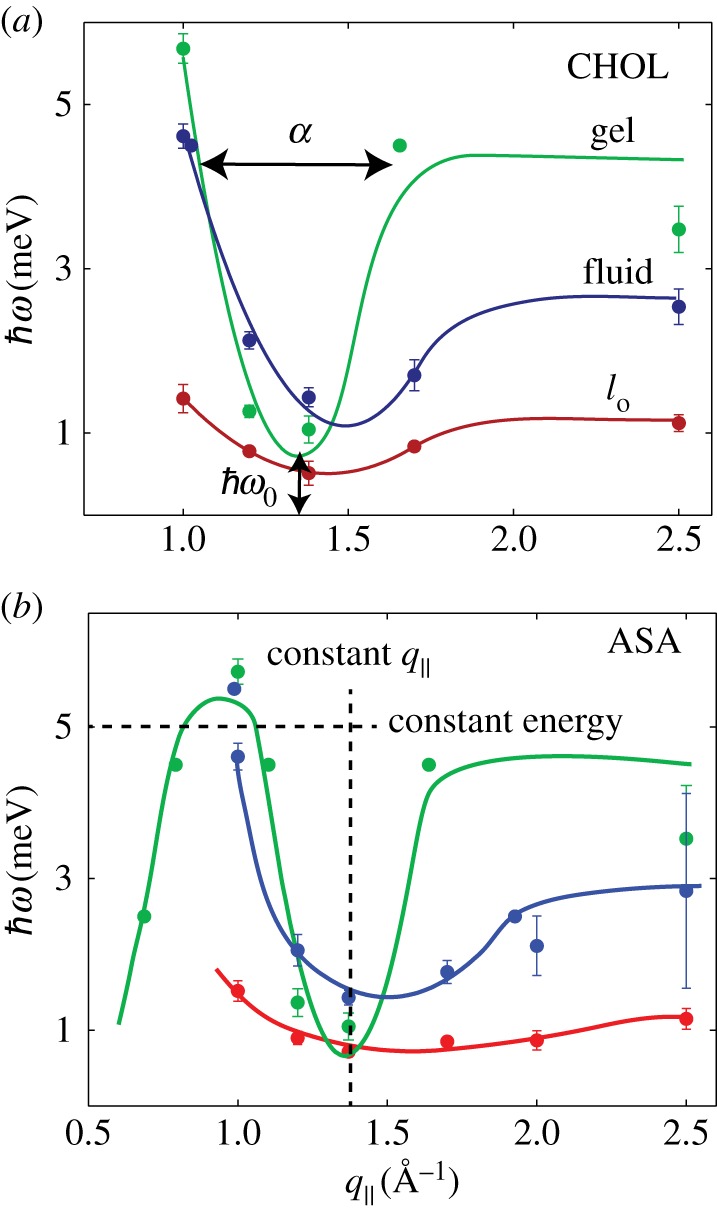
Dispersion relations for (a) the CHOL sample and (b) the ASA sample, as determined from constant-q∥ and constant-energy scans in figure 1. Three dispersion branches were observed, related to lipid molecules in gel (Pβ), fluid (Lα) and liquid-ordered (lo) patches. The CHOL dispersion in (a) is in qualitative agreement with previous reports on the collective short-wavelength dynamics in cholesterol-rich lipid membranes [42]. The meaning of the parameters α and in equation (2.1) are displayed in (a). The direction of constant-q∥ and constant-energy scans is shown in (b).