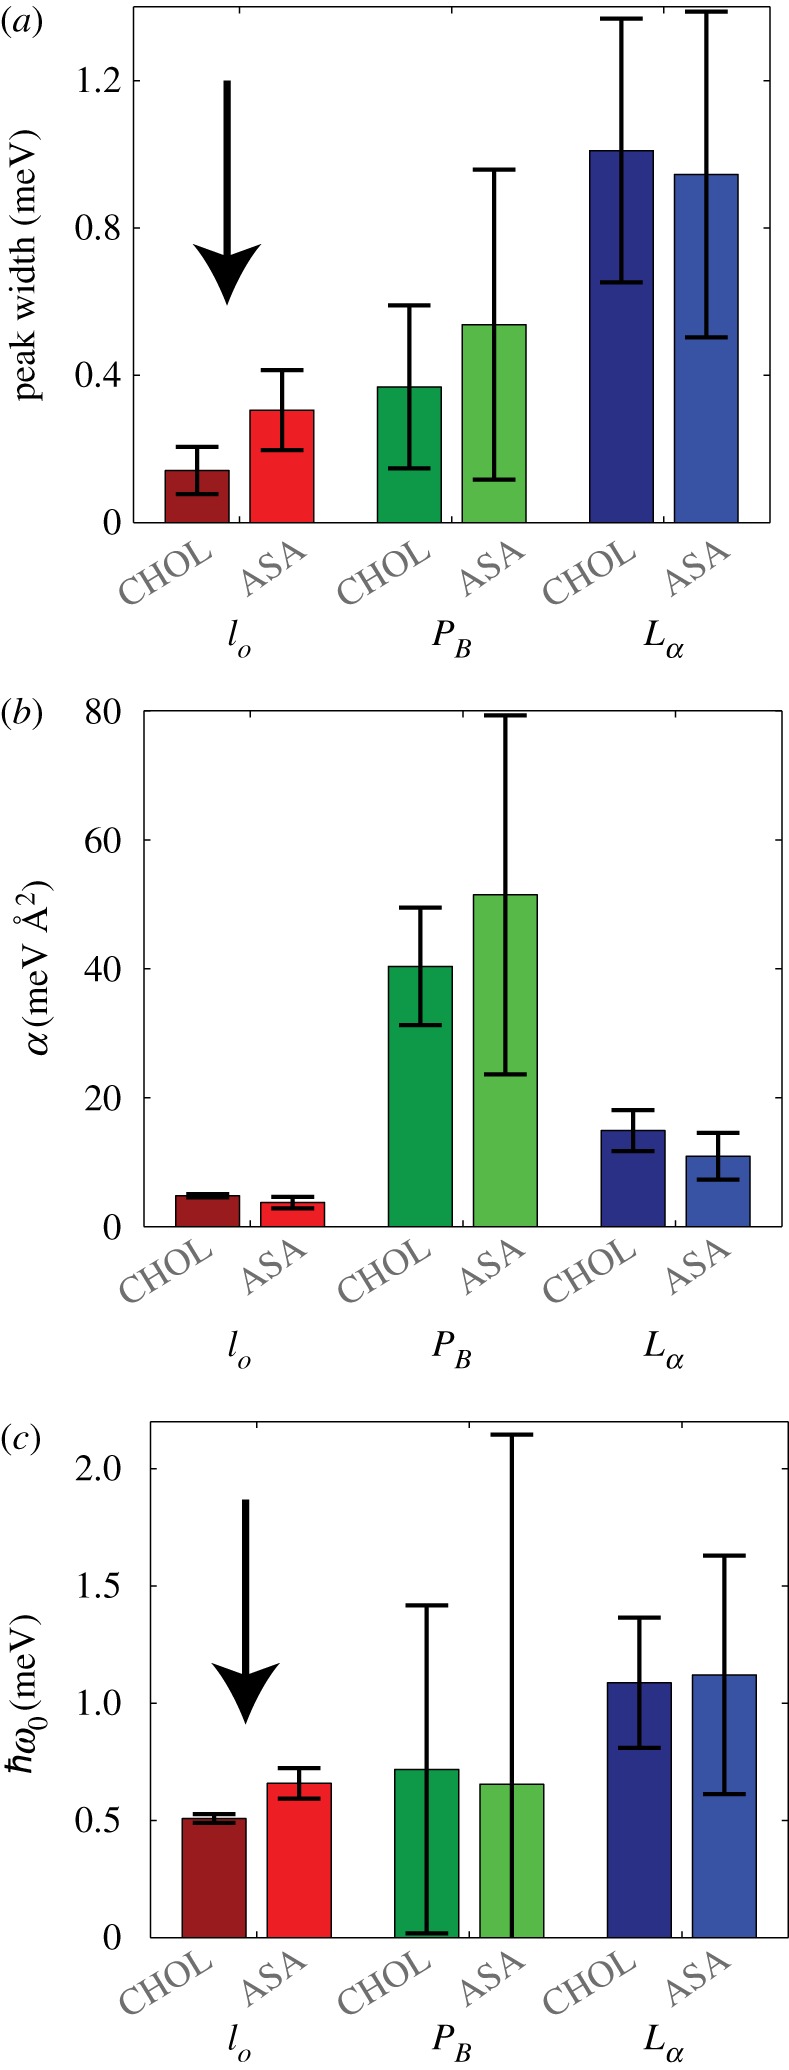
Figure 3.

(a) Phonon widths for gel, fluid and lo phase in figure 2 from phonon lines measured at q∥=1.37 Å −1. (b) Parameters α and from equation (2.1) from fits to the dispersion curves. Statistically significant differences between CHOL and ASA samples were observed in the phonon width (a) and energy value of the minimum (c) in the lo phase, only. Statistically significant results are indicated by the arrow.
