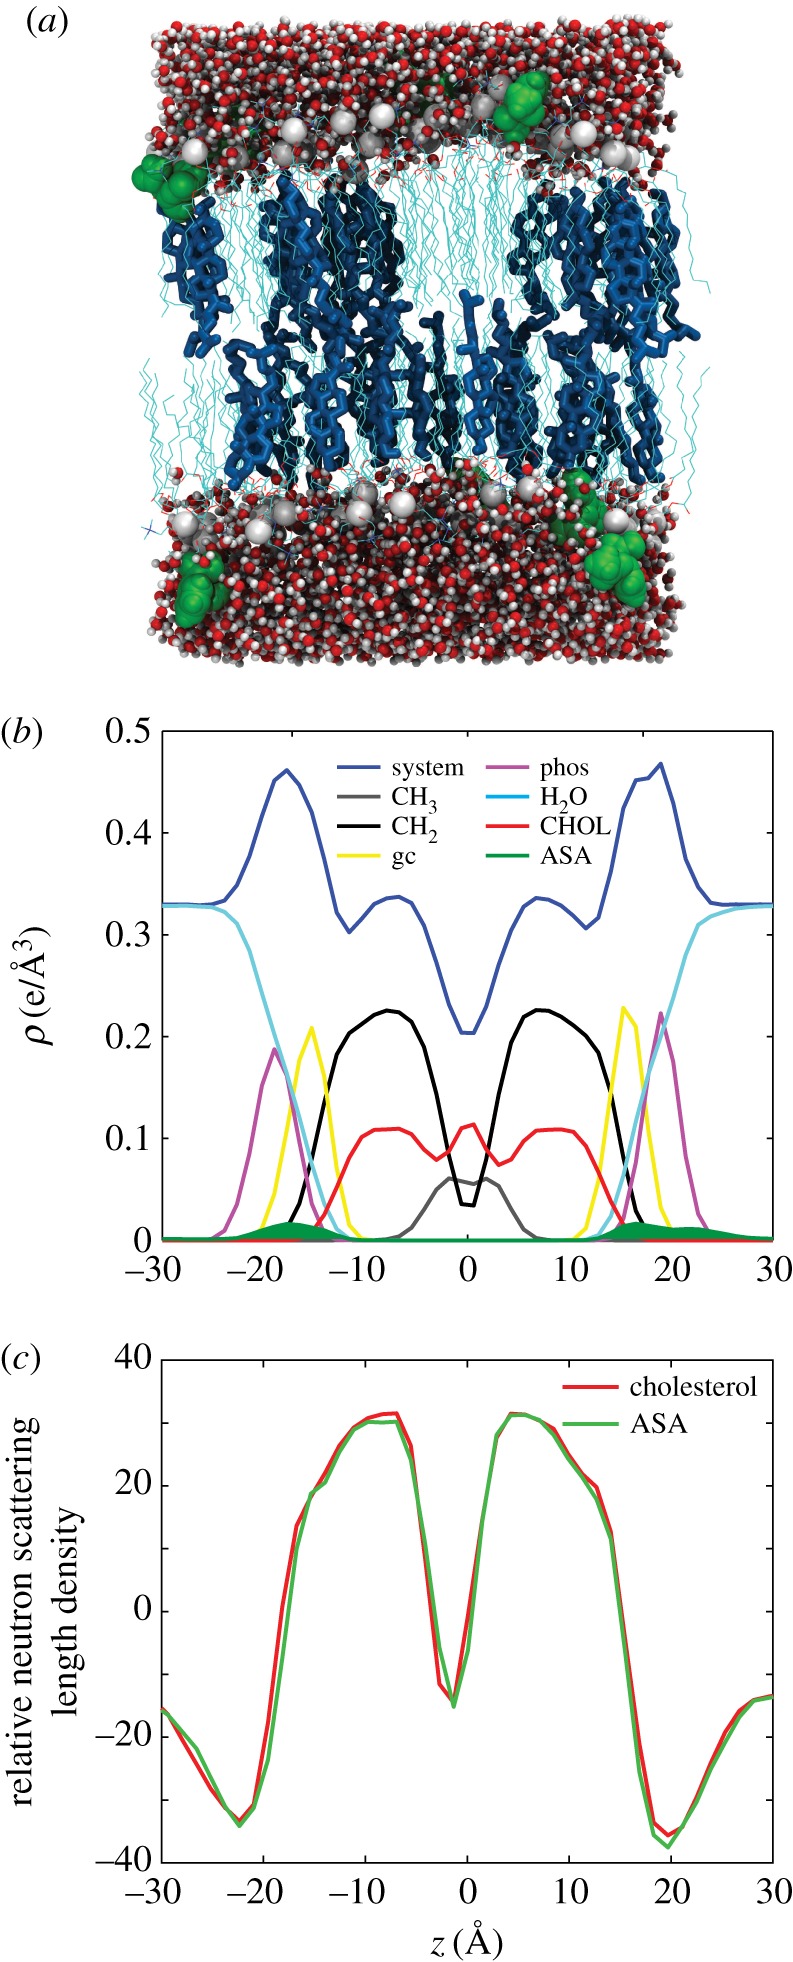
Figure 4.

Results of the MD simulations. Simulations were performed for 30 mol% cholesterol in DMPC (CHOL), and the same system with 10 mol% ASA (ASA). (a) A snapshot of the ASA simulation. (b) An electron density breakdown for the components of the bilayer, indicating that the position of ASA (green) is in the head groups at |z|∼20 Å . (c) Neutron SLD from MD simulations. While the simulations were run in protonated membranes, the deuterium-labelled atoms were considered to be deuterated for the SLD calculation, as reported in [55].
