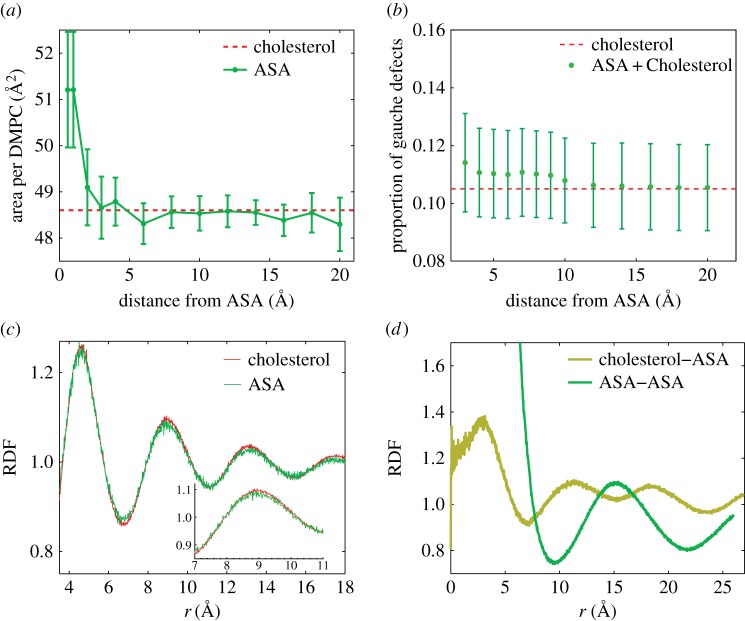
Figure 5.
(a) Area per DMPC molecule at increasing distance from an ASA molecule. (b) Proportion of gauche defects in the DMPC molecules at increasing distance from ASA. (c) Radial distribution function (RDF) for DMPC–DMPC correlations, taken from both CHOL and ASA simulations. (d) RDF for cholesterol–ASA and ASA–ASA interactions.

