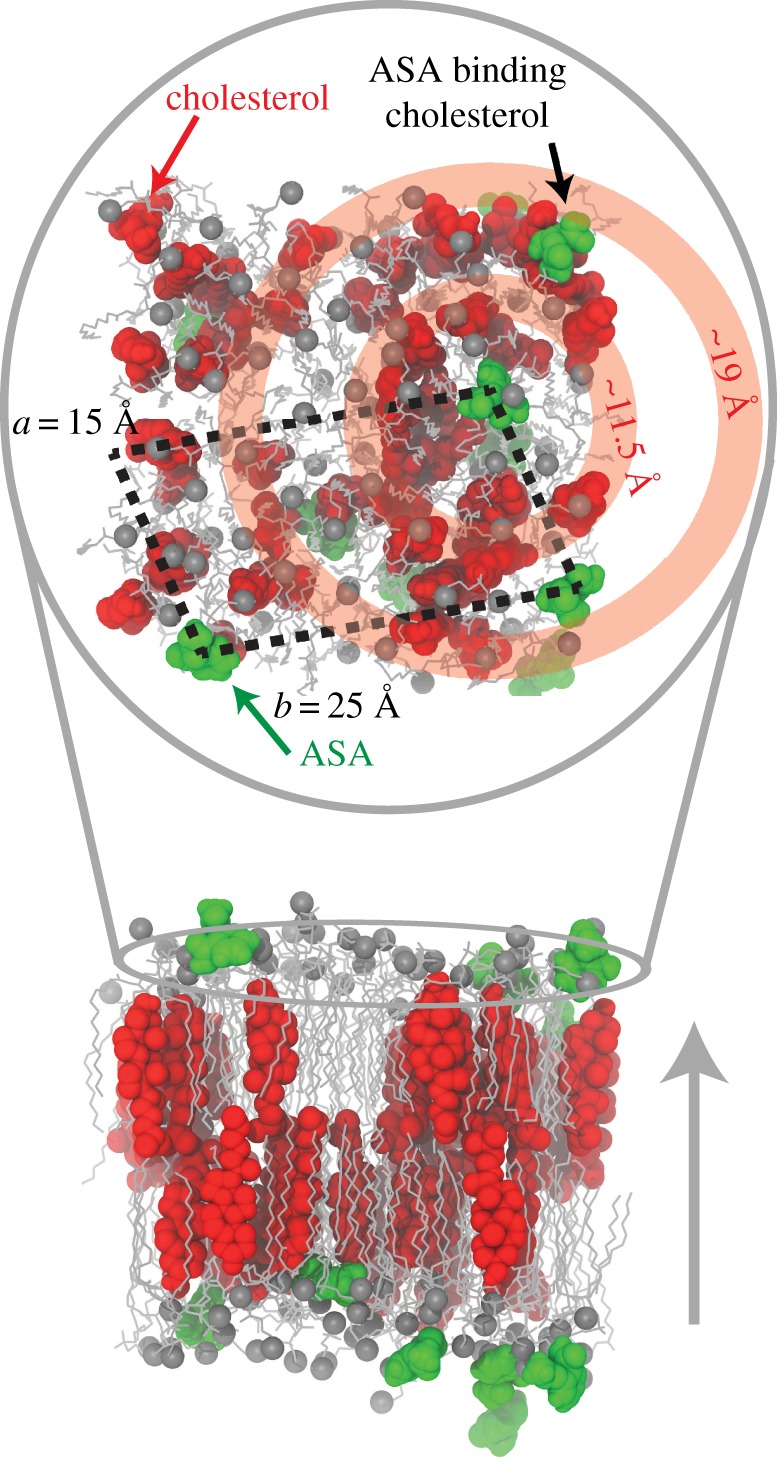
Figure 6.

A simulation snapshot that captures the main points of the paper. The upper panel is an overhead view (along qz). The black dashed lines indicate the lateral separation of ASA into a lattice-like structure. The concentric red circles, centred on ASA, illustrate that cholesterol molecules prefer to be at regular distances from ASA.
