
Figure 2.
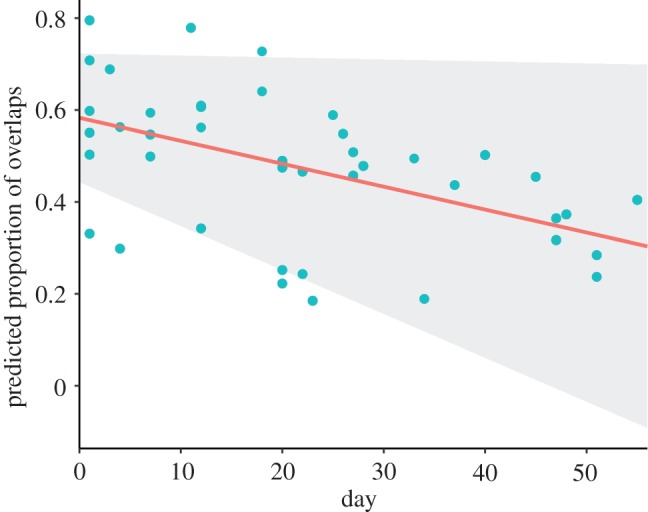
Proportion of phrases of the opposite sex per duet that juveniles overlapped with their own phrases across time. The red line represents the fixed effect of day over the proportion of phrases overlapped. The blue dots represent the predicted values by the model. The shaded area represents the 95% confidence intervals of the GLMM.