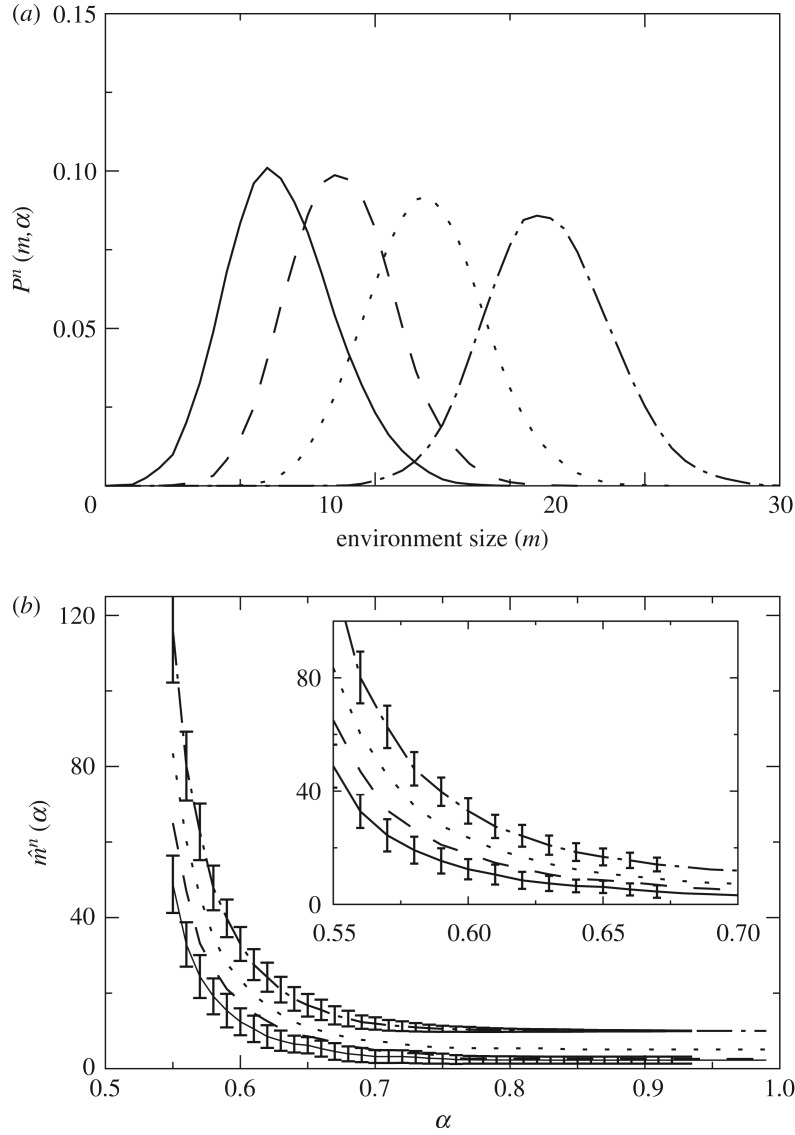
Figure 6.
Dynamics around . Again, guessers with n=1 (solid line), n=2 (dashed line), n=5 (dotted line) and n=10 (dot-dashed line). (a) Pn(m,α) tells us how often we find n-guessers in m-environments when they are allowed to roam constrained only by their survival function . The central value of Pn(m,α) must converge to and oscillations around it depend (through Ng and Ne) on how often we evaluate the guessers in each environment. (b) Average for n=1,2,5,10 and standard deviation of Pn(m,α) for n=1,10. Deviations are not presented for n=2,5 for clarity. The inset represents a zoom-in into the main plot.

