. 2018 Feb 19;8(14):7839–7846. doi: 10.1039/c7ra11943g

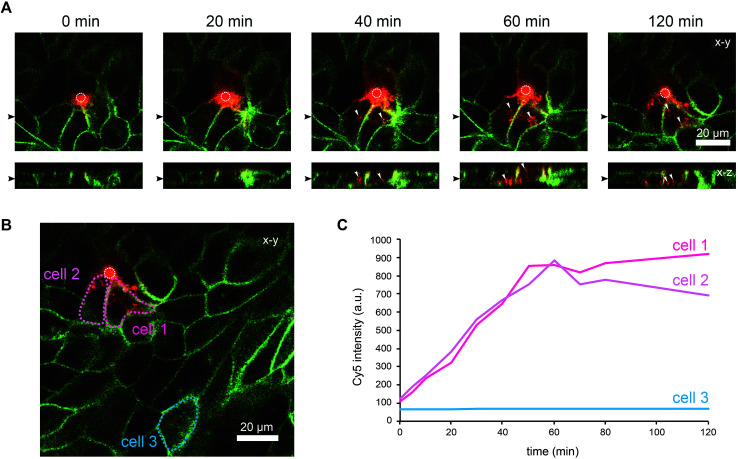
Fig. 4. Uptake of ligands by selected cells within an epithelial monolayer. MDCK cells stably expressing ML-GFP (green) were grown as polarised monolayer on the biochip. Medium containing 10 μM BambL-Cy5 (red) was introduced into the basolateral channel and a time-lapse recording with a confocal microscope was started. 0 min indicates the time at which BambL-Cy5 reached the cells through the pore. A white circle indicates the perimeter of the pore. (A) Representative time-lapse images from the recording. For each time point a xy section and a xz section are depicted, the positions of the respective image sections are indicated by black arrowheads. White arrowheads point to BambL-Cy5 that has been completely taken up by cells. (B) Larger overview image of the same monolayer as in (A), 120 min. The locations of cells contacting the pore (cells 1 and 2) and of a cell further away from the pore (cell 3) are indicated. (C) Graph showing the time course of the BambL-Cy5 signal from the cells indicated in (B).

Fig. 4