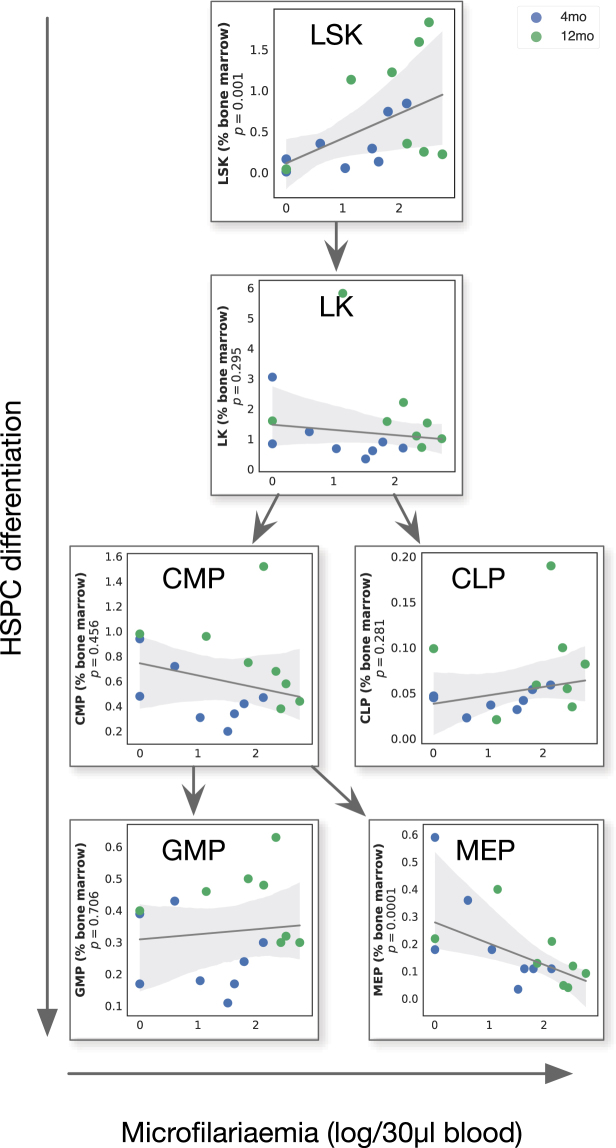
Figure 5.
Association between worm burdens and HSPC proportions through haematopoietic development. Robust regression between microfilaraemia and percentage of HSPC in the bone marrow through haematopoietic maturation. Each point represents a single mouse (both ages combined) and the shaded areas represent the 95% bootstrapped confidence intervals around the robust regression line. P values from GLM of main effect of log-transformed microfilariae counts on the described cell type (n = 16).

