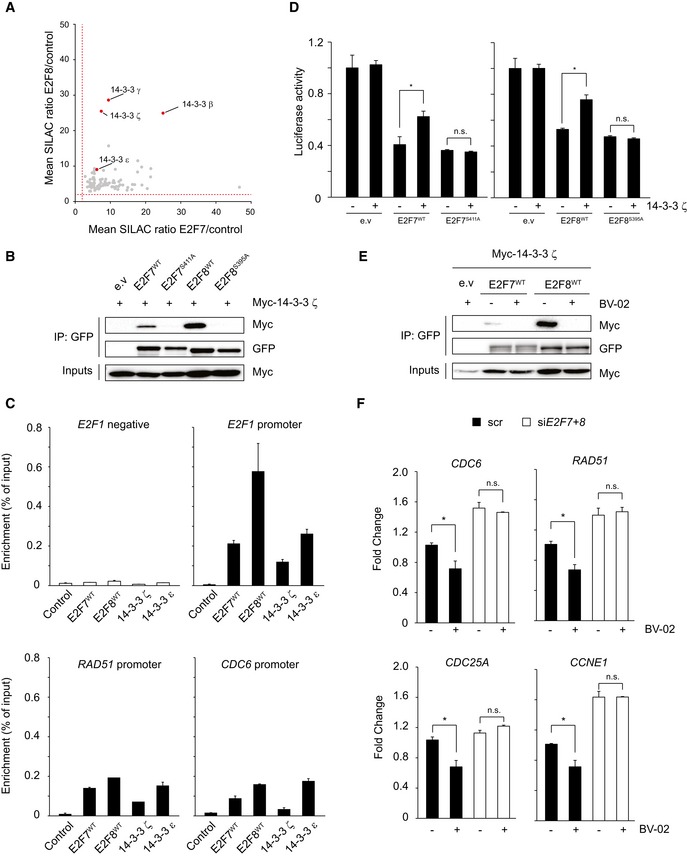
Figure 5. 14‐3‐3 ζ mediates Chk1‐dependent inhibition of E2F7/8.

- Scatter plot shows the relative enrichment scores of common E2F7 and E2F8 binding partners. Red dashed line indicates the fold change cutoff (> 2.0). 14‐3‐3 isoforms are highlighted as red dots.
- 14‐3‐3 ζ interacts with wild‐type E2F7/8 but not with alanine mutants in vitro. HEK 293T cells were transfected with indicated constructs, and lysates were precipitated with GFP‐Trap beads and immunoblotted with antibodies directed against Myc or GFP. Inputs represent loading controls.
- Chromatin immunoprecipitation (ChIP) demonstrated that 14‐3‐3 proteins bind to the E2F7/8 target gene promoters. HEK cells were transfected with either PEI reagent alone (control) or indicated plasmids. 48 h after transfection, cells were harvested for ChIP assay and followed by qPCR. Histogram represents the enrichment ratio (bound/input) in E2Fs target gene promoters. A primer set designed against a distal region in the E2F1 gene served as a negative control.
- Luciferase reporter assay in U2OS cells using E2F1 promoter plasmid. Plasmids were co‐transfected either with wild‐type or alanine mutant, either alone or with 14‐3‐3 ζ plasmid.
- 14‐3‐3 inhibitor BV‐02 disrupts the interaction between 14‐3‐3 ζ and E2F7/8. Transfection was carried out as shown, and lysates were precipitated with GFP‐Trap beads and immunoblotted with antibodies directed against GFP or Myc. Inputs represent loading controls.
- Transcript levels of common E2F7 and E2F8 target genes after treatment with HU or HU + BV‐02 for 16 h, determined by qPCR.
