-
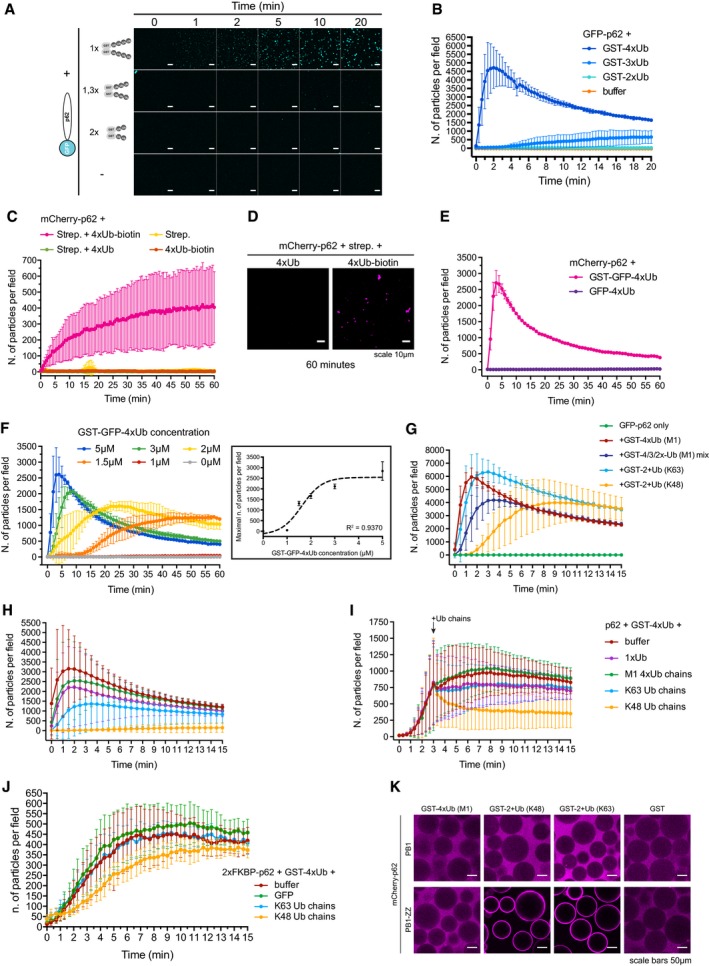
A
Representative micrographs of cluster formation assays conducted with GST‐tagged linear tetra‐, tri‐ or di‐ubiquitin. The total amount of ubiquitin moieties was kept identical in each condition. Scale bars: 10 μm.
-
B
Quantification of the data shown in (A).
-
C
Quantification of cluster formation assays conducted with the indicated proteins. mCherry‐p62 was pre‐incubated with the indicated 4xUb variants, followed by the addition of streptavidin immediately before imaging.
-
D
Representative micrographs of the indicated samples taken 60 min after addition of streptavidin.
-
E
Quantification of cluster formation assays conducted with the indicated proteins.
-
F
Quantification of cluster formation assays conducted with 2 μM mCherry‐p62 incubated with the indicated concentration of GST‐GFP‐4xUb. Box: the highest particle number per field detected in each sample was plotted against the relative GST‐GFP‐4xUb concentration. Data points were fitted to a sigmoidal curve. The regression coefficient is indicated.
-
G
Quantification of cluster formation assays conducted with GFP‐p62 and the indicated GST‐tagged ubiquitin chains.
-
H, I
Quantification of cluster formation assays performed with mCherry‐p62 and GST‐4xUb in the presence of the indicated free ubiquitin chains. Ubiquitin chains were either pre‐mixed with p62 before the addition of GST‐4xUb (H), or added 3 min after the addition of GST‐4xUb to p62 (I).
-
J
Quantification of cluster formation assays conducted with mCherry‐2xFKBP‐p62 in the presence of AP20187, GST‐4xUB, and the indicated Ub chains.
-
K
Representative micrographs of glutathione beads coated with the indicated GST‐tagged proteins and incubated with the indicated mCherry‐p62 variants.
Data information: In all pictures, the brightness was adjusted to highlight the profile of the beads. For all graphs, averages and SDs from at least three independent replicates are shown.