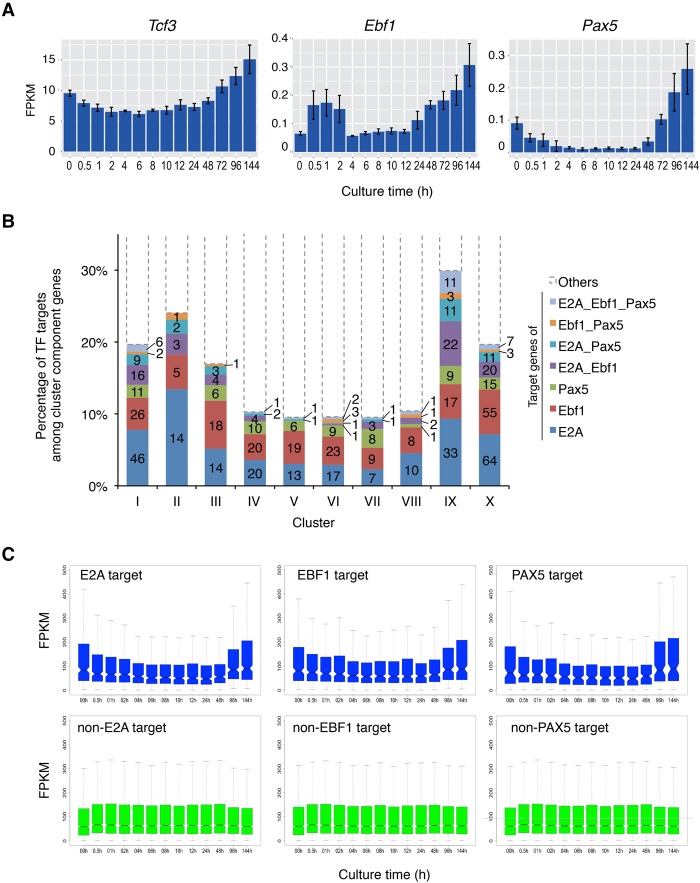
Figure 2.
Transition of core TF targets during B-cell commitment in the iLS system. (A) mRNA expression profiles of Tcf3 (E2A), Ebf1, and Pax5. (B) Composition of TF (E2A, EBF1, and PAX5) targets among clusters defined in Figure 1F. The Y-axis represents the percentage of target genes of each TF, and the actual numbers of targets are also shown in bars. (C) Box plot representation for expression of TF target and non-TF target genes. The notches in the box plot indicate 95% confidence interval.

