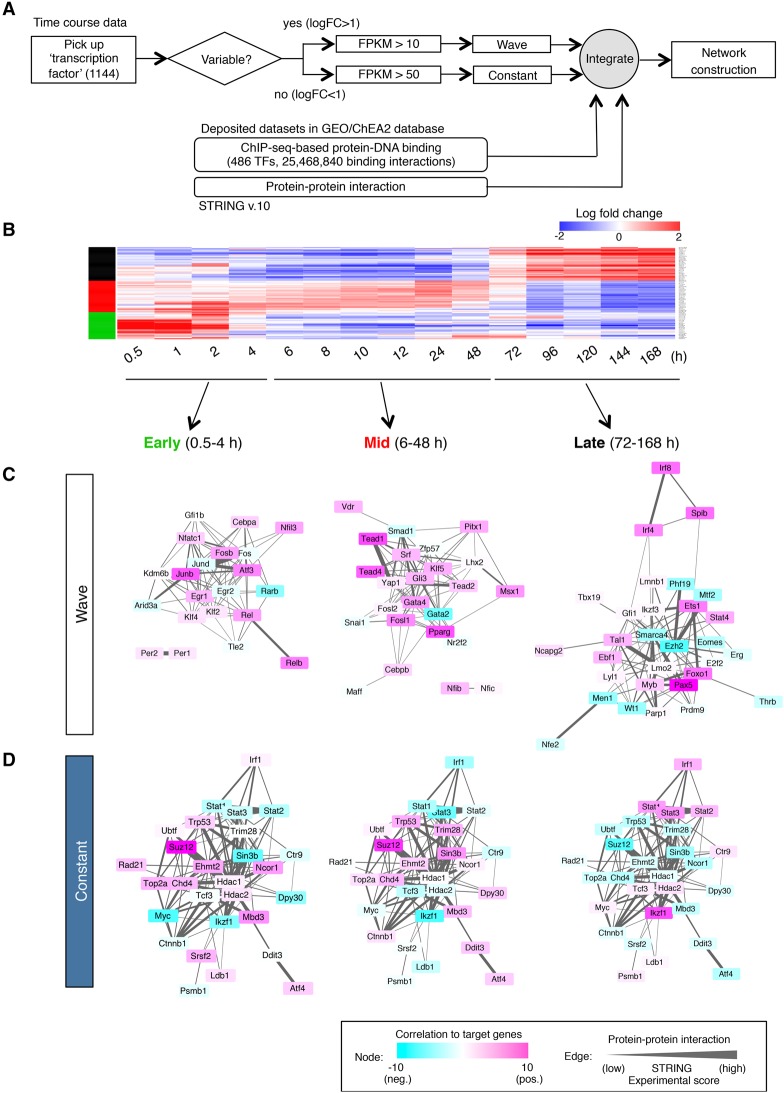
Figure 3.
Proposed gene regulatory network in B-cell fate determination. (A) Strategy for the construction of a network. (B) Gene expression profiles of highly variable TFs. Three major wave factors (early, mid, and late) are indicated as green, red, and black bars at the left. See also Supplemental Table 4 for the details of the expression profile (log fold change). (C,D) Transcriptional regulatory network during B-cell commitment. A network of wave factors (C) and constant factors (D) is shown in three time phases (early, mid, and late). The color of each node represents the transcriptional activity (activation or suppression of expression of their postulated downstream target genes) at each time frame. The thickness of the edge indicates the probability of protein–protein interaction (experimental score in the STRING database).

