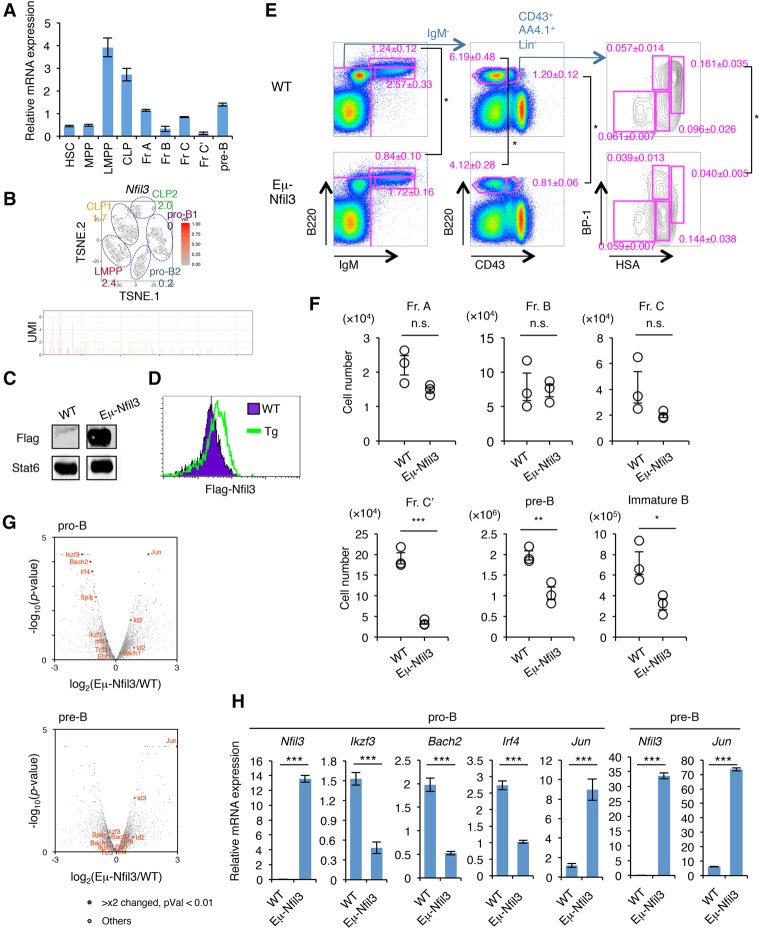
Figure 6.
Prolonged Nfil3 expression perturbs normal B-cell commitment. (A) qRT–PCR analysis of Nfil3 in HSPCs and early B-cell progenitors in BM. Values represent mean ± SD in a representative of two independent experiments. The gating strategy for each fraction is shown in Supplemental Figure S8. (B) Expression profile of Nfil3 in BM progenitors at the single-cell level. The t-SNE projection and UMI count of Nfil3 in LMPP, CLP, and pro-B cells in BM are shown. The number in the t-SNE projection indicates the percentage of expressing cells in each cluster. (C) Western blotting of Flag tag in B220+ cells in the spleens of Eμ-Nfil3 Tg and littermate control (wild-type [WT]) mice. See also Supplemental Figure S10B for a schematic of the construct. (D) Intracellular staining of Flag tag in B220+ cells in the spleens of Eμ-Nfil3 Tg and wild-type mice. (E,F) FACS profiles (E) and cell number (F) of B-cell progenitor population in wild-type and Eμ-Nfil3 Tg mice. Values represent mean ± SD in a representative of three independent experiments. (*) P < 0.05; (**) P < 0.01; (***) P < 0.001. (G) Volcano plot for a comparison of gene expression status in pro-B (top) or pre-B (bottom) cells in BM of wild-type and Eμ-Nfil3 Tg mice. The X-axis indicates the expression ratio of Eμ-Nfil3 Tg versus wild-type cells, and the Y-axis indicates the statistical significance. The expression differences and significance of selected genes (difference between Eμ-Nfil3 and wild-type is greater than twofold; P-value is <0.01) are listed in Supplemental Table S9. (H) qRT–PCR analysis of differentially expressed genes in pro-B and pre-B cells in BM of wild-type and Eμ-Nfil3 Tg mice. Values represent mean ± SD in a representative of two independent experiments. (***) P < 0.001.

