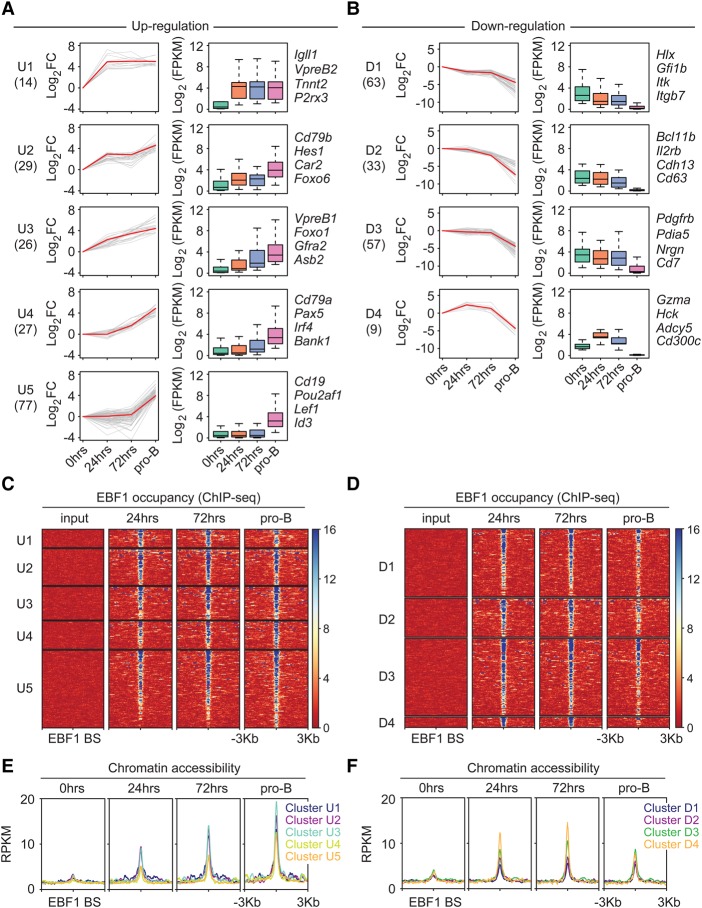
Figure 3.
Time-resolved analysis of transcript levels of genes containing EBF1-occupied sites within ±25 kb of transcription start sites before and after EBF1 induction (A,B). Up-regulated and down-regulated genes that change transcript levels >10-fold between 0 h and the pro-B stage are shown in A and B, respectively. Genes that are regulated by twofold to 10-fold are shown in Supplemental Figure S4, A and B. Individual transcript levels are shown in Supplemental Table S1 (>10-fold changes) and Supplemental Table S2 (twofold to 10-fold changes). Genes are organized into different clusters based on expression pattern using Short Time-series Expression Miner (STEM) (Ernst and Bar-Joseph 2006). Line plots (left panels) and box plots (right panels) are used to show fold changes (log2 scale) and absolute expression levels (log2 scale), respectively. Representative genes of each cluster are listed at the right. In each line plot, one representative gene is highlighted in red. (FC) Fold change; (FPKM) fragments per kilobase per million reads. (C,D) Dynamics of EBF1 occupancy around ±3 kb of EBF1 peaks that are associated with up-regulated genes (C) and down-regulated genes (D). Clusters correspond to the RNA-seq analysis. (E,F) ATAC signals around ±3 kb of EBF1 peaks associated with up-regulated genes (E) and down-regulated genes (F).

