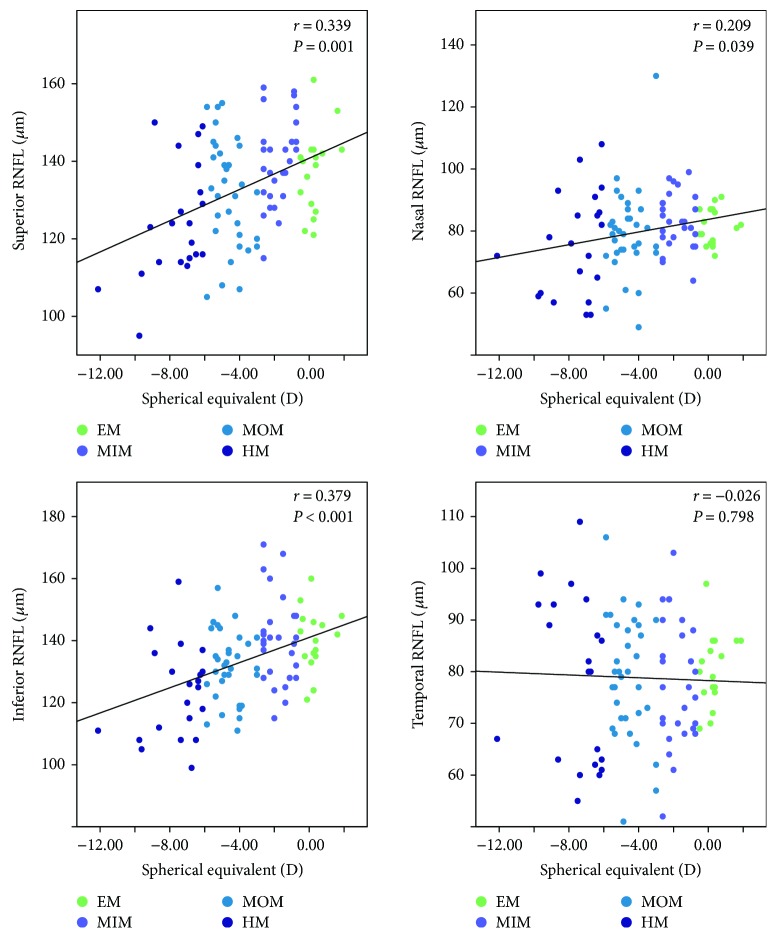
Figure 3.
Scatterplots illustrating the linear (black line) associations between spherical equivalent (D) and optical coherence tomography angiography (OCTA) peripapillary quadrant (superior, nasal, inferior, and temporal) RNFL thickness (μm) measurement of the studied eyes. r, correlation coefficient from the Spearman rank correlation analysis; EM, emmetropia, MSE 0.50 D to −0.50 D; MIM, mild myopia, MSE −0.75 D to −2.75 D; MOM, moderate myopia, MSE −3.00 D to −5.75 D; HM, high myopia, MSE ≤ −6.00 D.

