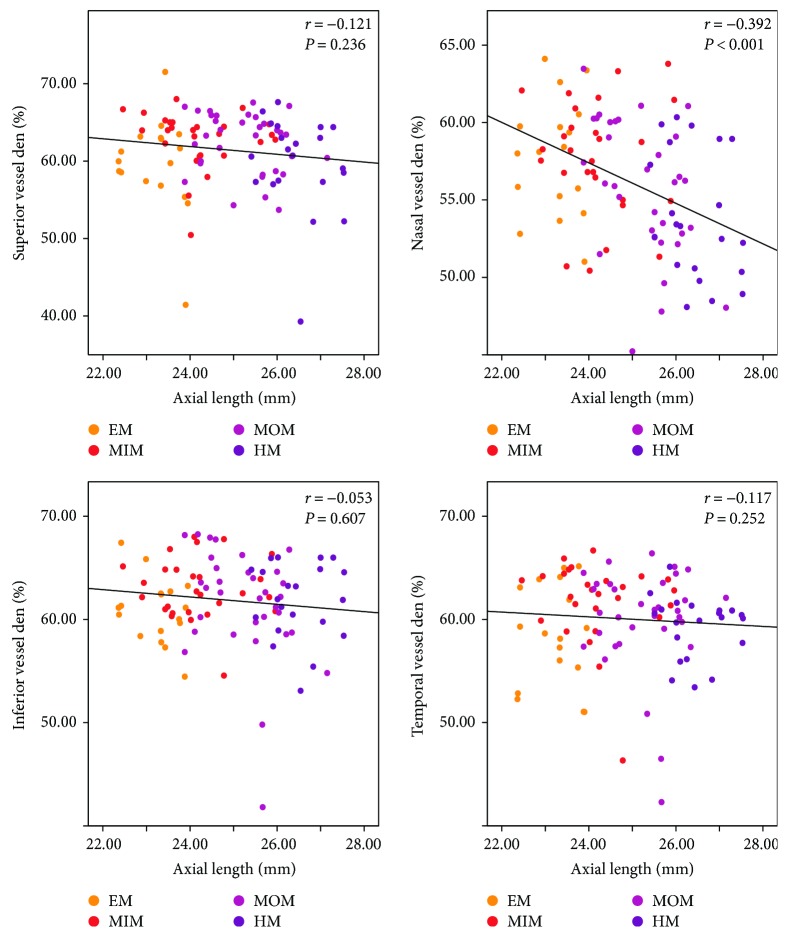
Figure 4.
Scatterplots illustrating the linear (black line) associations between axial length (mm) and optical coherence tomography angiography (OCTA) peripapillary quadrant (superior, nasal, inferior, and temporal) vessel density (%) measurement of the studied eyes. r, correlation coefficient from the Spearman rank correlation analysis; EM, emmetropia, MSE 0.50 D to −0.50 D; MIM, mild myopia, MSE −0.75 D to −2.75 D; MOM, moderate myopia, MSE −3.00 D to −5.75 D; HM, high myopia, MSE ≤ −6.00 D.

