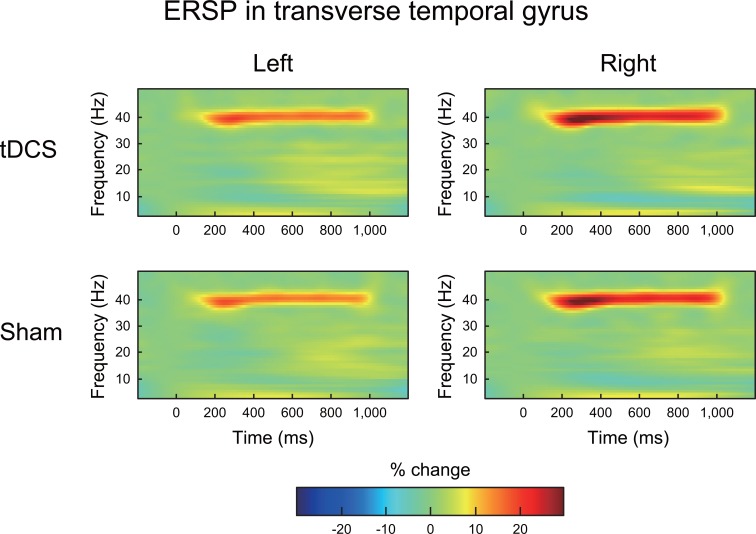
Fig 3. The grand average of the time-frequency maps of the ERSP in the transverse temporal gyrus under both tDCS and sham conditions.
In each map, the x-axis indicates time (ms), and the y-axis indicates frequency (Hz). The color indicates the ERSP at each time-frequency point (reflected as the percentage change from baseline). The gamma-band (40 Hz) ASSR derived from the 40 Hz auditory stimulation was clearly observed under the tDCS and sham conditions.

