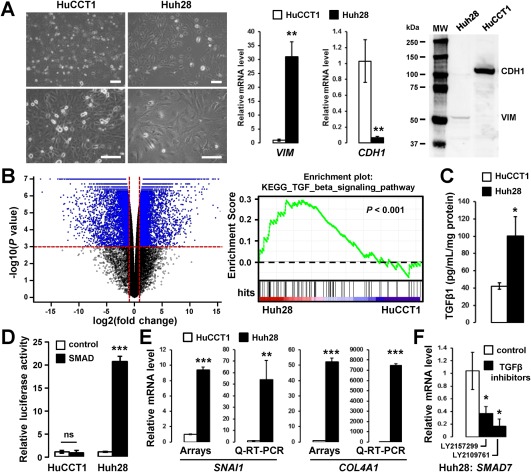
Figure 1.

HuCCT1 and Huh28 cell lines exhibit an epithelioid and a mesenchymal‐like phenotype respectively, the later correlating with endogenous activation of the TGFβ pathway. (A) Phase contrast micrographs of HuCCT1 and Huh28 cells (left panel; scale bar, 100 µm) and expression of vimentin and E‐cadherin at the RNA (middle panel) and protein level (right panel). (B) Volcano plot of genes differentially expressed between HuCCT1 and Huh28 (left panel) and GSEA highlighting a TGFβ signature enriched in the gene expression profile of Huh28. (C) Enzyme‐linked immunosorbent assay demonstrating increased secretion of TGFβ1 in the supernatant of Huh28 cells 24 hours after overnight serum starvation. (D) Relative luciferase activity of HuCCT1 and Huh28 engineered cell lines in which a luciferase gene is under the transcriptional control of a TATA box alone (white bars) or with SMAD responsive elements (black bars). Luciferase activity was measured at the basal level without exogenous addition of TGFβ after overnight serum starvation. (E) Gene expression analysis of TGFβ target genes in HuCCT1 and Huh28 cells at the basal level by microarray and Q‐RT‐PCR. (F) Q‐RT‐PCR analysis of TGFβ target gene SMAD7 in Huh28 cells treated with 10 µM TGFβ inhibitors (black bars). Statistical analysis was performed by t test (*P < 0.05; **P < 0.01; ***P < 0.001); n ≥ 3 replicates. Data represent mean ± SD. Abbreviations: mRNA, messenger RNA; MW, molecular weight.
