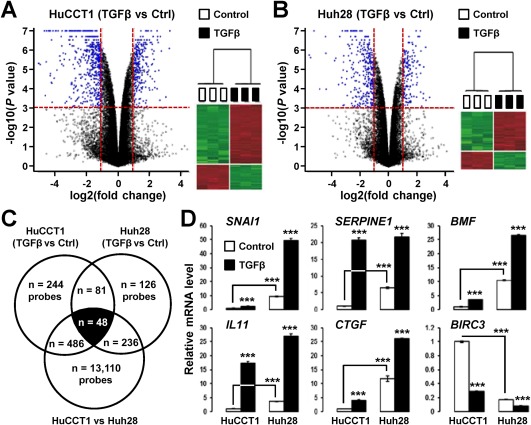
Figure 2.

A TGFβ‐specific gene expression signature in cholangiocarcinoma cell lines. (A,B) Volcano plot and hierarchical clustering of genes differentially expressed by TGFβ (1 ng/mL, 16 hours) in (A) HuCCT1 and (B) Huh28 cells. Horizontal dashed lines on volcano plots, P < 0.001; vertical dashed lines, fold change >2. (C) Venn diagram analysis of genes differentially expressed by TGFβ in HuCCT1 and Huh28 cells. A common TGFβ signature made of 48 probes (42 nonredundant well‐annotated genes) was identified. (D) Expression of six well‐known TGFβ target genes in HuCCT1 and Huh28 cells after 16 hours of culture in absence (white bars) or presence (black bars) of 1 ng/mL TGFβ. Statistical analysis was performed by t test (*P < 0.05; **P < 0.01; ***P < 0.001); n ≥ 3 replicates. Data represent mean ± SD. Abbreviation: Ctrl, control.
