Figure 4.

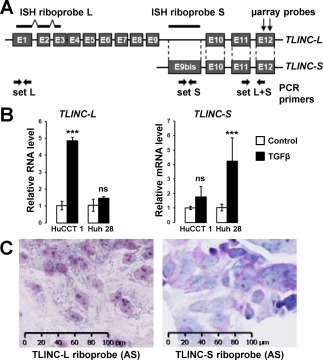
Expression and cellular localization of TLINC isoforms. (A) Simplified representation of TLINC locus highlighting two reported isoforms: TLINC‐L and TLINC‐S. ISH riboprobes, sets of PCR primers, and microarray probes are also represented. (B) Analysis of TLINC‐L and TLINC‐S expression in HuCCT1 and Huh28 cells after 16 hours of culture in the absence (white bars) or presence (black bars) of 1 ng/mL TGFβ, as evaluated by Q‐RT‐PCR using specific sets of primers. (C) In situ hybridization using TLINC‐L and TLINC‐S riboprobes highlights a nuclear and cytoplasmic location of both TLINC isoforms (HuCCT1 cells treated with 1 ng/mL TGFβ). Scale, 100 µm. Statistical analysis was performed by t test (*P < 0.05; **P < 0.01; ***P < 0.001); n ≥ 3 replicates. Data represent mean ± SD. Abbreviations: (AS), antisense; mRNA, messenger RNA; ns, not significant.
