
. 2018 Feb 20;2(3):245–253. doi: 10.1002/hep4.1148
© 2018 The Authors. Hepatology Communications published by Wiley Periodicals, Inc., on behalf of the American Association for the Study of Liver Diseases.
This is an open access article under the terms of the Creative Commons Attribution‐NonCommercial‐NoDerivs License, which permits use and distribution in any medium, provided the original work is properly cited, the use is non‐commercial and no modifications or adaptations are made.
Figure 3.
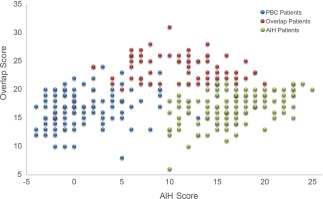
Scatterplot of overlap scores and AIH scores by patient group.