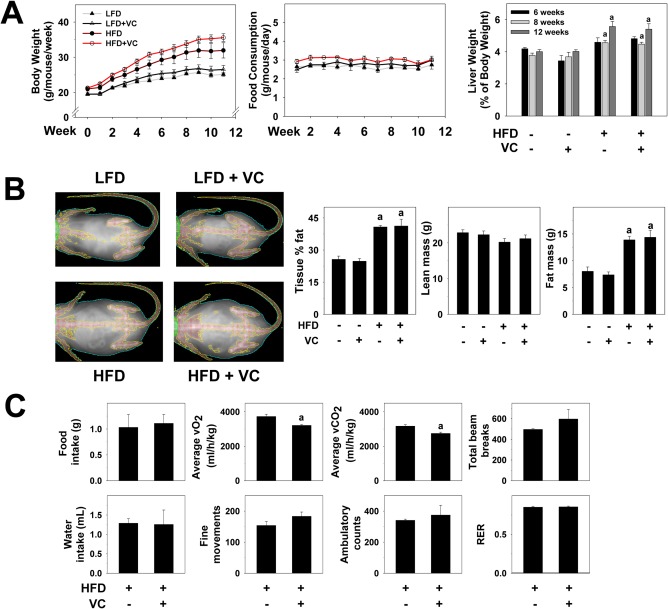
Figure 1.

Metabolic phenotype. (A) Body weights were measured once per week and are depicted for the 12‐week exposure period. Food consumption was measured twice per week for the 12‐week exposure period. Liver weight to body weight ratios were calculated for each group for each time point. (B) DEXAscan analysis was performed for all treatment groups at the 12‐week time point. Representative pictures are shown. Body mass is graphed as body fat in percentage of total tissue, lean body mass, and fat mass in grams. (C) Representative parameters of metabolic function are depicted for mice exposed to HFD ± VC. a P < 0.05 compared to LFD or HFD control. Results are presented as mean ± SEM. Sample size per group A‐C, n = 10‐12. Abbreviations: RER, respiratory exchange ratio; vCO2, carbon dioxide production; vO2, oxygen consumption.
