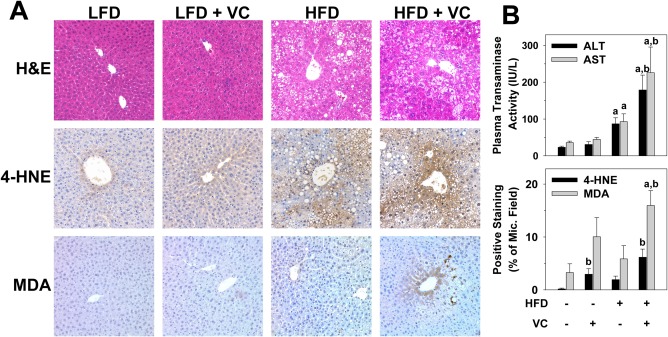
Figure 2.

VC enhanced liver damage caused by the HFD. (A) Representative photomicrographs of H&E (general morphology, ×200), 4‐HNE (oxidative stress, ×200), and MDA (oxidative stress, ×200) are shown at 12 weeks. (B) Plasma transaminase (ALT/AST) levels were determined for the 12‐week time point; image analysis for 4‐HNE and MDA are graphed as positive staining as percentage of microscope field. a P < 0.05 compared to LFD control; b P < 0.05 compared to absence of VC. Results are presented as mean ± SEM. Sample size per group, n = 5‐7. Abbreviations: 4‐HNE, 4‐hydroxynonenal; ALT, alanine aminotransferase; AST, aspartate aminotransferase; H&E, hematoxylin and eosin; MDA, malondialdehyde; Mic., microscope.
