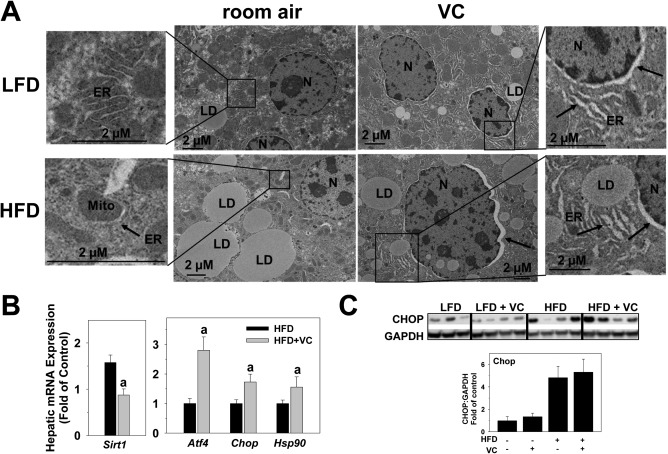
Figure 5.

VC caused ER stress. (A) Representative electron microscope photomicrographs are shown. Arrows denote dilated ER, including the nuclear membrane as part of the ER membrane. (B) Representative western blot and densitometric analysis of CHOP are shown. (C) Hepatic mRNA expression of ER stress markers Sirt1, Atf4, Chop, and Hsp90 are shown for HFD and HFD + VC (12 weeks). a P < 0.05 compared to HFD control. Results are presented as mean ± SEM. Sample size per group A, n = 10; B,C, n = 5‐7. Abbreviations: GAPDH, glyceraldehyde 3‐phosphate dehydrogenase; LD, lipid droplet; Mito, mitochondria; N, nucleus.
