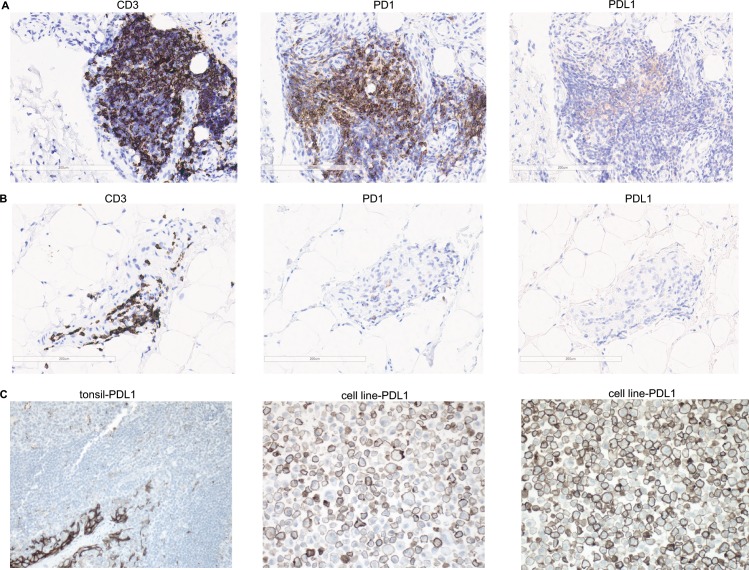
Fig 4. Immunohistochemistry analysis of CD3, PD1 and PD-L1 in treatment-naïve early RA synovial biopsies.
A. Representative IHC of tissue sections with abundant CD3, PD1 and 5% PD-L1 staining. B. Representative IHC of tissue sections with abundant CD3 and PD1 staining but <1% PD-L1 staining. C. Positive PD-L1 staining control in human tonsil tissue (left) and positive PD-L1 staining control in cell line overexpressing PD-L1 at low (middle) and high density (right), respectively. All images are shown at 20x. Data shown in A-B represents synovial biopsies from 17 early RA patients as illustrated in Table 2.

