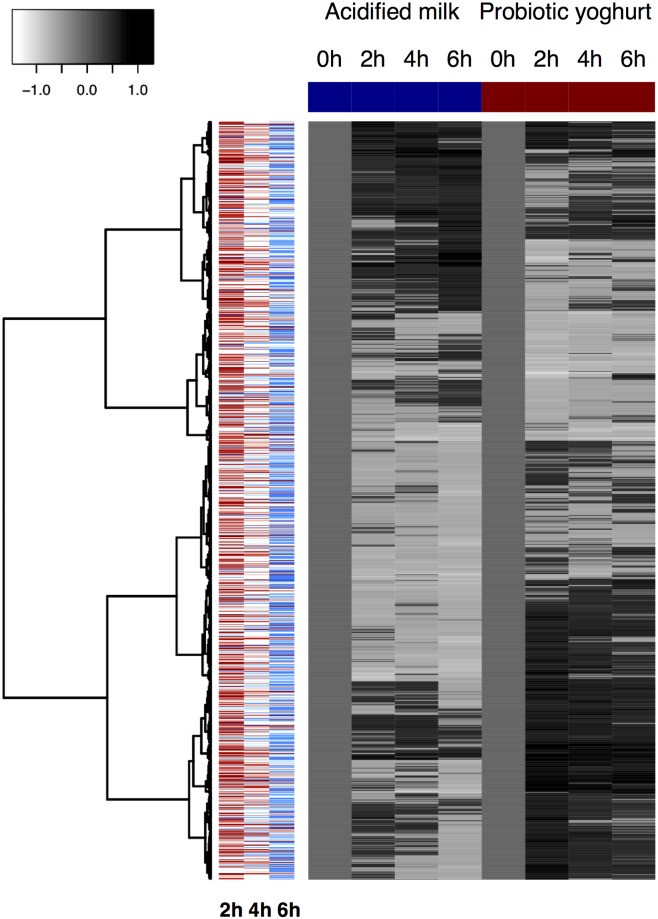
Fig 2. Heatmap showing the dynamic changes in gene expression after the intake of acidified milk (left) and yoghurt (right).
Genes that show a postprandial response (padj < 0.20) for at least one time point after either dairy product are visualised (n = 1,556), with up-regulation indicated by darker tones relative to fasting levels (0 h) and down-regulation indicated by lighter tones. Clustering was completed using Euclidean distance and Ward’s criterion [49]. For the three times assessed, colours in the left side panel indicate whether the observed response was greater after yoghurt or acidified milk (assessment based on the absolute t values: red = response greater after yoghurt, blue = response greater after acidified milk; dark colours show responses significant at a level of p < 0.01, light colours indicate responses significant at a level of p < 0.05).

