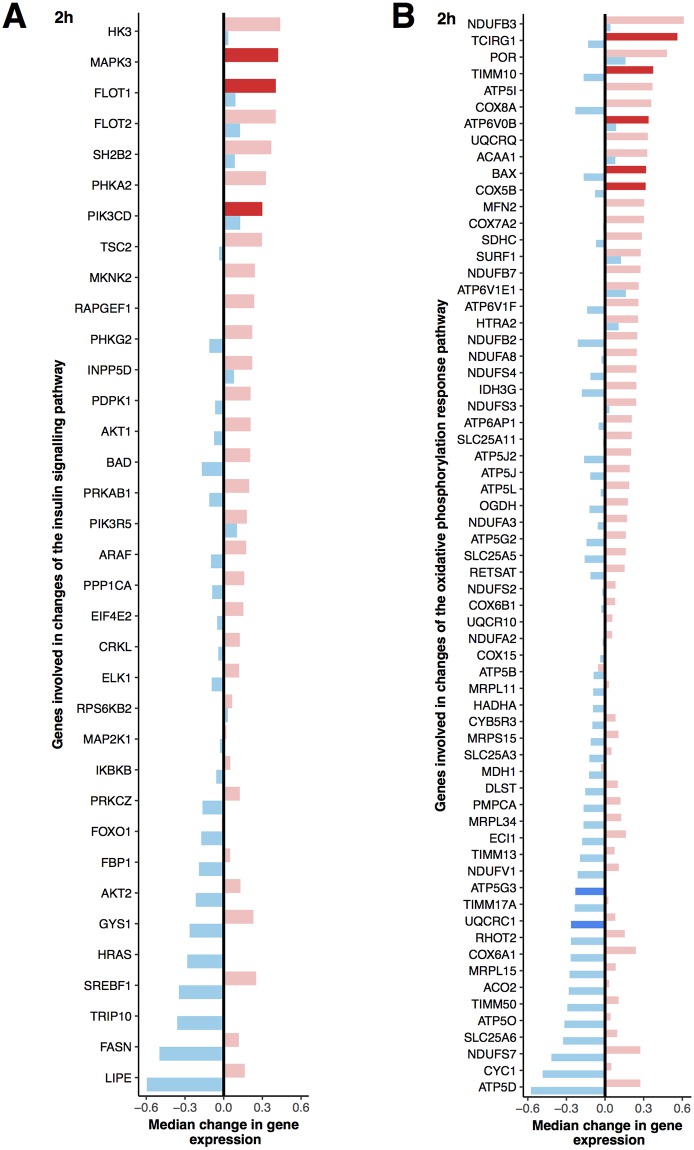
Fig 6. Genes that are implicated in the differential regulation of A. KEGG insulin signaling pathway and B. oxidative phosphorylation pathway at 2 h.
The median response for each gene is illustrated by a bar (blue for acidified milk, red for yoghurt) and ordered by the dairy condition that elicited the greatest change in gene expression. Lighter colours show non-significant responses and dark shades show a significant change after intake of the dairy product (p < 0.01).

