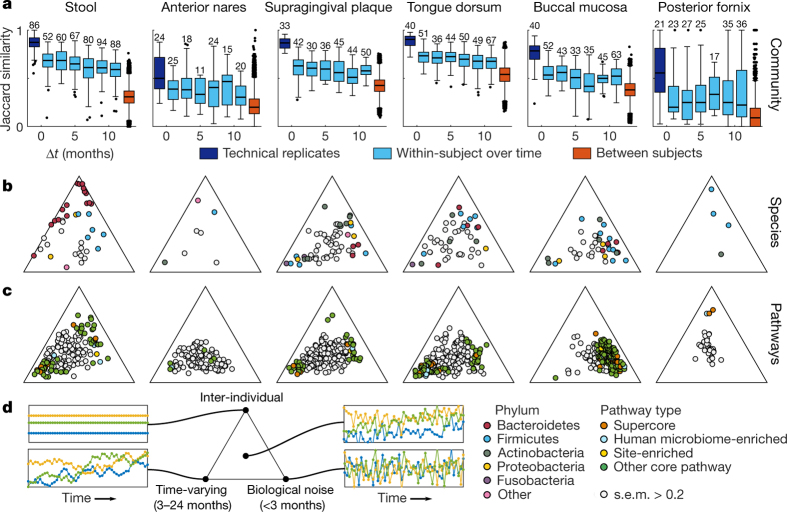
Figure 3. Temporal dynamics of individual species and microbial pathways at each targeted body site.
a, Jaccard similarity is maximal between technical replicates and decreases with time, although within-subject similarity always exceeds between-subject similarity. b, Gaussian process decomposition of the variance in species abundances (each point is one species; filtering criteria in Methods) into three biologically relevant components based on their characteristic timescales (Methods). Technical noise was estimated (Supplementary Table 5) but not visualized. Species with high inference uncertainty (s.e.m. on the ternary diagram > 0.2) are grey and the inference is biased towards the centre of the diagrams (Methods). Labelled version in Extended Data Fig. 5. c, Same as b, but for abundances of all core pathways. d, Illustrative time series showing dynamics at different locations within the ternary plots (Extended Data Fig. 4d–f for real examples). Sample counts in Supplementary Table 1.

