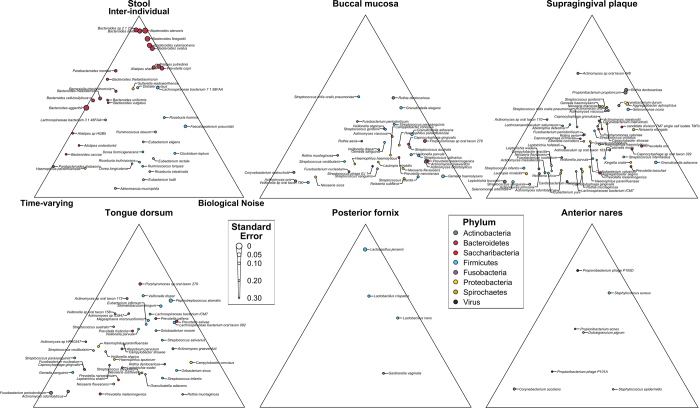
Extended Data Figure 5. Gaussian process decomposition of temporal variance for metagenomic species abundances.
The posterior mean of the decomposition of variance (Methods) is shown for each species (Supplementary Table 5), coloured by phylum. Uncertainty in the estimate was assessed by the square root of the mean squared distance on the ternary plot of MCMC samples from the posterior mean, and is codified with larger points indicating more certain estimates.

