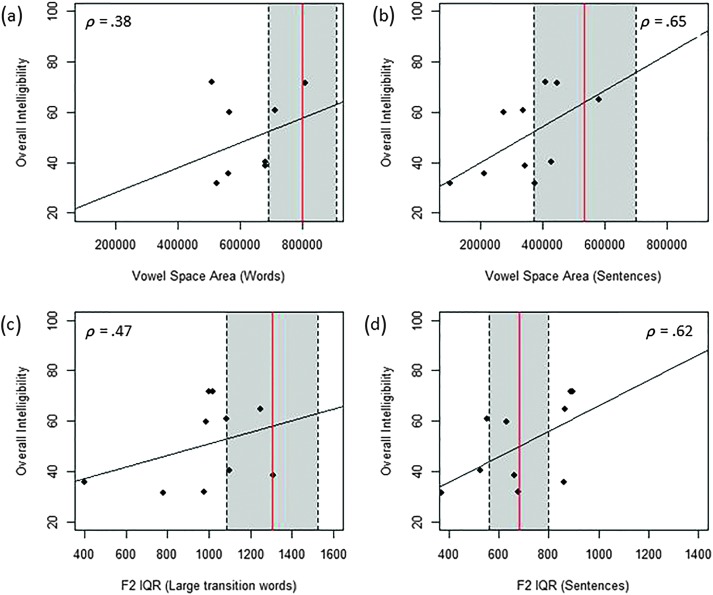
Figure 4.
Scatterplots showing the correlation between overall intelligibility and acoustic variables for children in the SMI group. For each acoustic measure, red lines denote the average value of children in the TD group, and the shaded regions indicate 1 SD above and below the TD mean. Graphs show the relationship between overall intelligibility and (a) single-word vowel space, (b) sentence vowel space, (c) second formant interquartile range (F2 IQR) of large transition words, and (d) F2 IQR of sentences.

