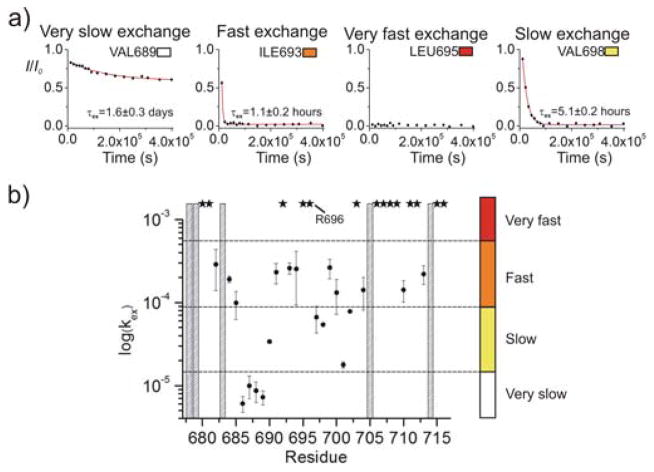
Figure 2.
Solvent accessibility of gp41TMD. (a) Signal decay over time for residues V689, I693, L695 and V698, each representing one of the four defined exchange regimes. (b) Residue-specific kex reported in logarithmic scale. Amide protons with exchange too fast to be measured are marked with stars. Residues that could not be analyzed (overlapping peaks and Pro714) are marked with gray bars. The color spectrum on the right represents the four different exchange regimes: very fast (red), fast (orange), slow (yellow), and very slow (white: very slow).

