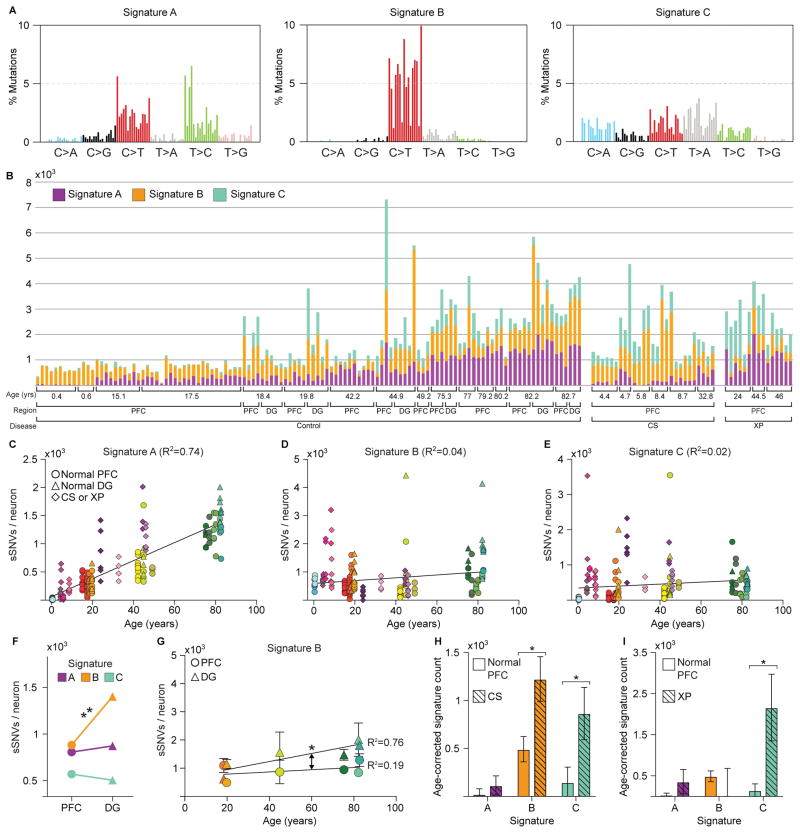
Figure 3. Signature analysis reveals mutational processes during aging, across brain regions, and in disease.
(A) Three mutational signatures identified by non-negative matrix factorization (each substitution is classified by its trinucleotide context). (B) Number of variants from Signatures A, B, and C in each of the 161 neurons in the dataset. (C–E) Signature A strongly correlates with age, regardless of disease status or brain region, while Signatures B and C do not. (F) Signature B is enriched in DG relative to PFC neurons. (G) Signature B increased with age in DG neurons, but not in matched PFC neurons, revealing a DG-specific aging signature. Solid shapes represent regional means, and transparent shapes represent individual neurons. (H–I) Comparison of age-corrected estimate of sSNVs per signature in CS and XP compared to PFC controls revealed enrichment in Signature C in both CS and XP. * and ** denote p ≤ 0.05 and p ≤ 0.001, respectively, mixed linear model.

