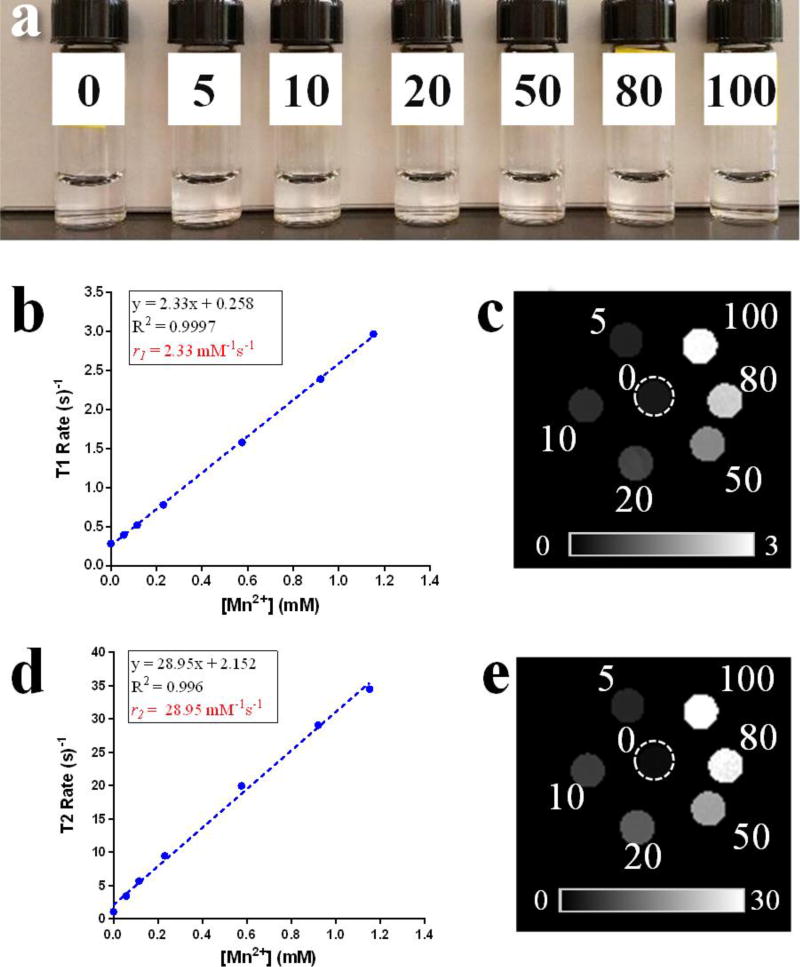
Figure 4.
Photo of 0, 5, 10, 20, 50, 80, 100 µg mL−1 MnO2 nanotubes treated with GSH (4 mM) after 15 mins (a). T1 rates (b) and T1 rate map (c), T2 rates (d) and T2 rate map (e) against various Mn2+ concentrations measured after MnO2 nanotubes were treated with GSH. Dashed circle indicates location of (−) nanotube phantom.

