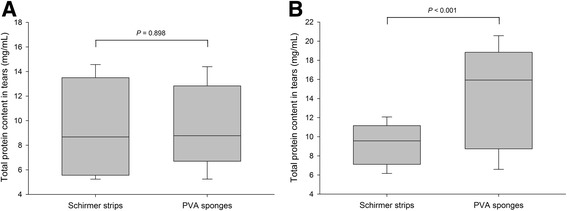
Fig. 1.

Box-and-whisker plots depicting the total protein content in tear samples collected in 10 healthy dogs (a) and 10 healthy cats (b) with either Schirmer strips or PVA sponges. Median values are shown by a horizontal line. First and third quartiles (25th and 75th percentiles) are represented by the lower and upper limits of the box, respectively. The 2.5th and the 97.5th percentiles are shown as the lower and upper whiskers, respectively
