
Fig. 3.
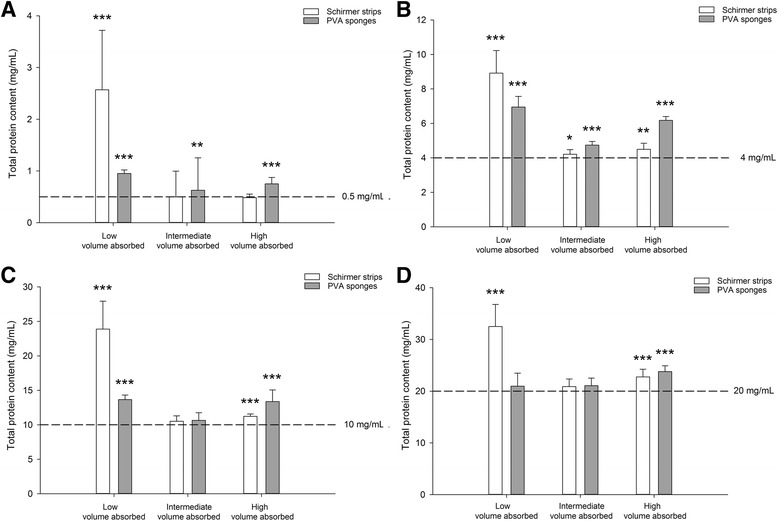
Bar charts depicting the mean + standard deviation of TPC from in vitro experiments evaluating 12 combinations of volume absorbed/protein concentration in both Schirmer strips (white bars) and PVA sponges (gray bars): low, intermediate and high volumes of 0.5 mg/mL (a), 4 mg/mL (b), 10 mg/mL (c), and 20 mg/mL (d) BSA solutions. In each panel, statistical differences between the absorbent materials and the control BSA solution are shown by asterisks: * P < 0.05, ** P < 0.01, *** P < 0.001