Fig. 1.

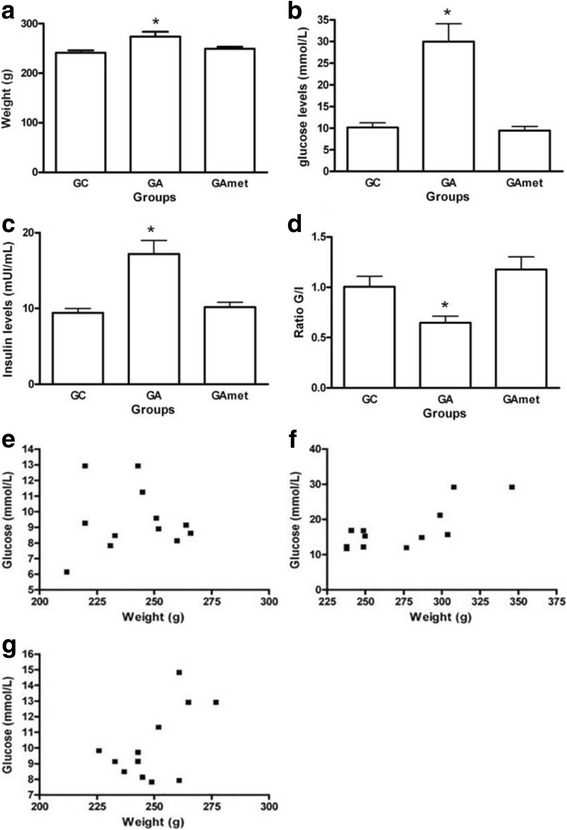
Weight measurements and biochemical analysis. a Weight of the rats in the following groups: CG (control group), GA (androgen group), and GAmet (metformin group). p = 0.049 (ANOVA and Tukey’s test). b GA rats exhibited the highest glucose values, *p = 0.038 (Kruskal-Wallis and Dunn tests). c The insulin levels of the GA group were higher than those of the other groups, p < 0.01(Kruskal-Wallis and Dunn tests). d The lowest glucose/insulin ratio was observed in the GA group, * p < 0.01. e Spearman rank test of the correlation of glucose with weight in CG rats (no significant correlation). f Spearman rank test of the correlation of glucose with weight in GA rats (no significant correlation). g Spearman rank test of the correlation of glucose with weight in GAmet rats (no significant correlation)
