
Fig. 3.
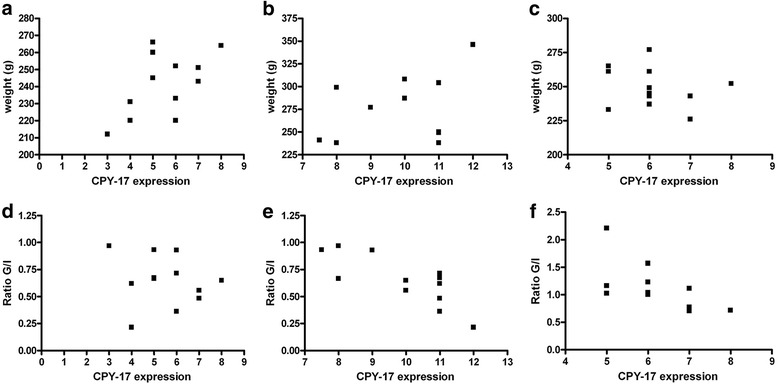
Graphical representations of the Spearman rank test for the correlation of the weight data withCYP17 expression in thecae cells of the (a) CG group (control group, no correlation), (b) GA group (androgen group, no correlation), and (C) GAmet group (metformin group, no correlation). d–f show graphical representations of the correlations between the glucose/insulin ratio data and CYP17 expression in theca cells. d CG, no correlation, (e) GA, significant correlation (r = − 0.81, p = 0.001), and (f)GAmet, significant correlation (r = − 0.61, p = 0.03)