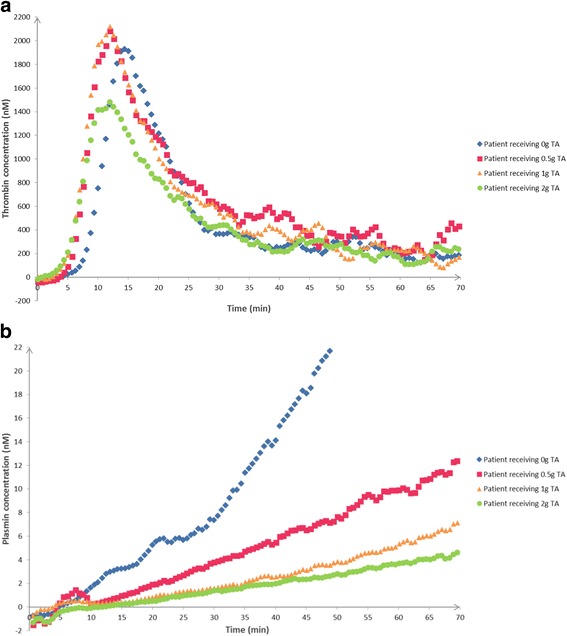
Fig. 5.

a In vivo study: TA dose impact on thrombin generation profiles at T30. In vivo thrombin generation variations at T30 depending on TA dose administered: four patients who received 0, 0.5, 1, and 2 g (IV bolus), respectively. b In vivo study: TA dose impact on plasmin generation profiles at T30. In vivo plasmin generation variations at T30 depending on TA dose administered: four patients who received 0, 0.5, 1, and 2 g (IV bolus), respectively.
