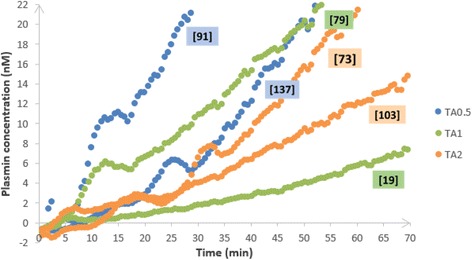
Fig. 8.

Plasmin generation profile at T0 (baseline) and corresponding TA peak plasma concentration at T1 (following injection) in TA-treated patients. Plasmin generation profiles at T0 (baseline, before injection) and corresponding TA peak plasma concentrations at T1 (just after injection, values in mg/L bracketed in little sidebars) of six patients treated by TA: two patients by dose (0.5, 1, and 2 g)
