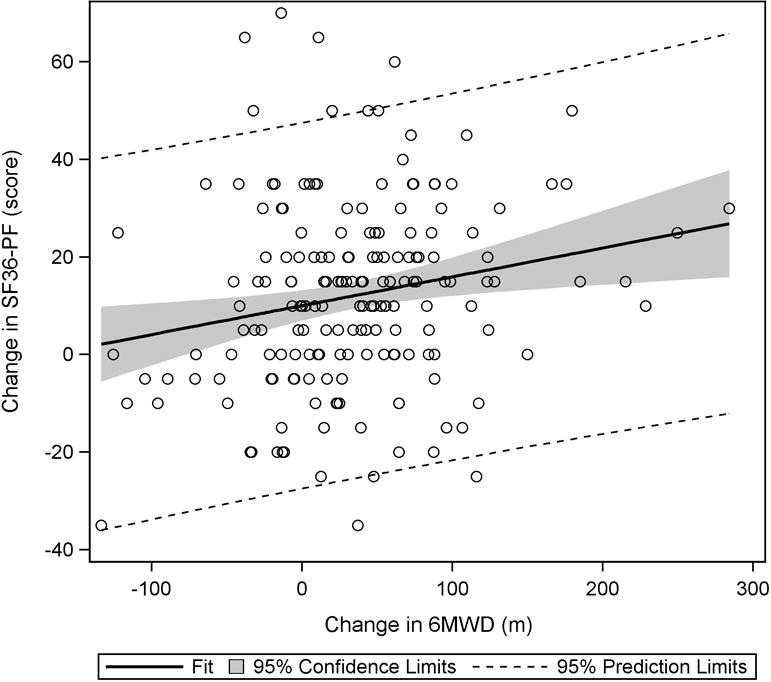
Figure 2.

Plot of change in SF36-PF vs. change in 6MWD. From baseline to week 36, a significant positive trend was observed, indicating that as 6MWD increased, scores on the SF36-PF subscale also increased.

Plot of change in SF36-PF vs. change in 6MWD. From baseline to week 36, a significant positive trend was observed, indicating that as 6MWD increased, scores on the SF36-PF subscale also increased.