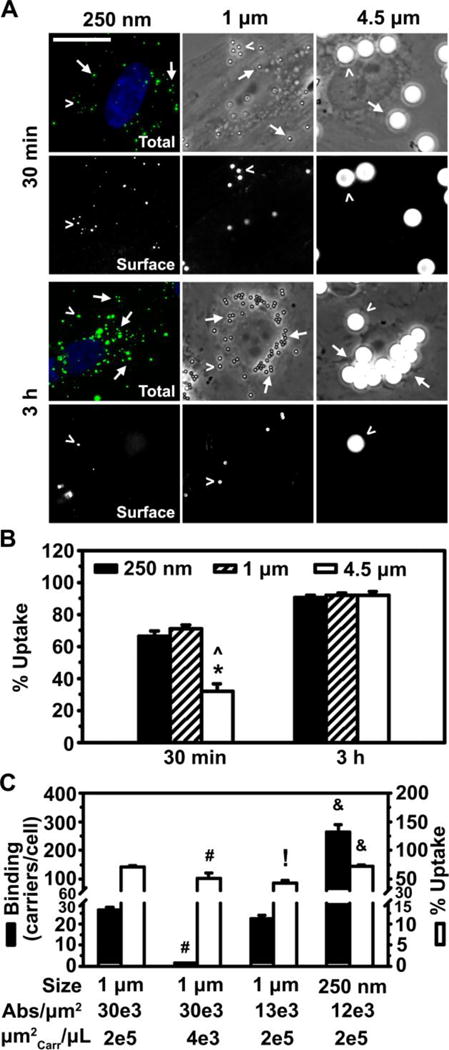
Figure 3.

Uptake of anti-ICAM carriers by endothelial cells. (A) Endocytosis of 250 nm, 1 μm or 4.5 μm anti-ICAM carriers bearing saturating anti-ICAM density on the carrier coat (b in Table 1), after 30 min or 3 h incubation at 37˚C with activated HUVECs. For each time-point, top panels show total carriers, and bottom panels show surface-bound carriers. Submicrometer carriers contain a green fluorophore. In all cases, cell-surface located carriers are immunostained in red (see Materials and Methods). Arrows indicate internalized carriers and arrowheads mark surface-bound carriers. Scale bar = 20 μm. (B) Quantification of uptake, expressed as the percent of carriers inside cells from the total number of cell-associated carriers. Mean ± SEM. *Compares 1 μm or 4.5 μm to 250 nm; ^compares 4.5 μm to 1 μm (p<0.05 by Tukey’s test after One-way ANOVA). (C) Binding and uptake of carriers incubated at 37˚C with activated HUVECs for 30 min, according to size (250 nm vs. 1 μm), antibody (Ab) coating density per carrier surface area (12,000 to 30,000 Abs/μm2), and carrier surface area (μm2Carr) per μL of cell medium (4,000 or 200,000 μm2Carr/ μL). Mean ± SEM. #Compares carriers of same size and valency but different concentrations (two left sets of bars); !compares carriers of same size and concentration but different valencies (first-left and third sets of bars); &compares carriers of same valency and concentration but different sizes (two last-right sets of bars) (p<0.05 by Student’s t-test).
