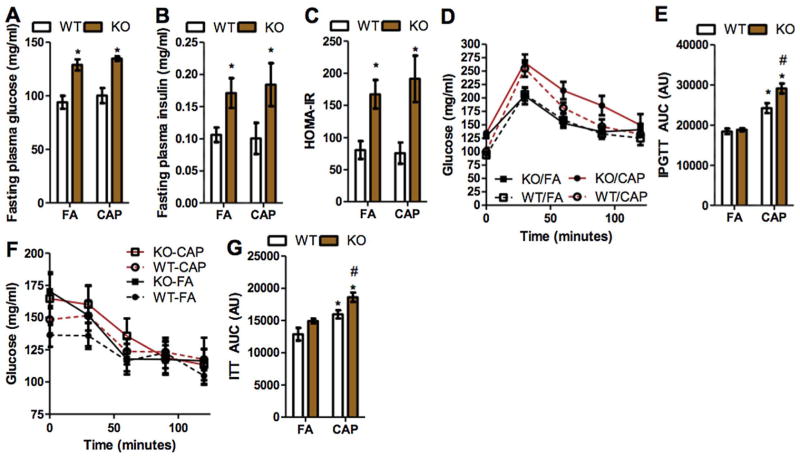
Fig. 2.
TNF/LT deficiency aggravates CAP exposure-induced glucose intolerance. A–C, mice were starved for 16 h and the glucose (A) and insulin (B) levels in plasma were assessed, and HOMA-IR (C) was calculated using these data. *p < 0.05 versus FA and #p < 0.05 versus WT, two way ANOVA. D and E, mice were starved for 16 h, and subjected to i.p. injection with glucose (2 g/kg body weight). The response of plasma glucose (D) and area under the curve (E) are presented. *p < 0.05 versus FA and #p < 0.05 versus WT, two way ANOVA. F and G, mice were starved for 4 h, and subjected to i.p. injection with insulin (0.5 unit/kg body weight). The response of plasma glucose (F) and area under the curve (G) are presented. *p < 0.05 versus FA and #p < 0.05 versus WT, two way ANOVA.

