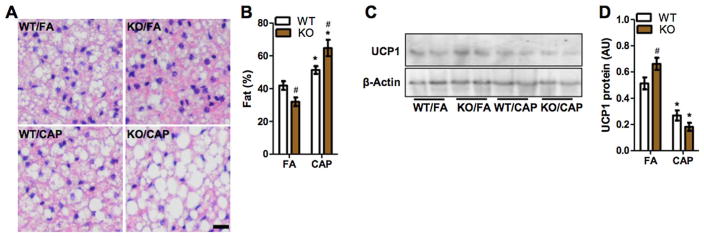
Fig. 6.
TNF/LT deficiency enhances CAP exposure-induced BAT whitening. A and B, morphological analysis of mouse BAT. The representative images (A) and the quantitation of fat droplet area (B) are presented. Scale bar, 20 μm. *p < 0.05 versus FA and #p < 0.05 versus WT, two way ANOVA. C and D, UCP1 protein levels in BAT were determined by western blot, and the representative images (C) and the quantitation of protein levels (D) are presented. *p < 0.05 versus FA and #p < 0.05 versus WT, two way ANOVA.

