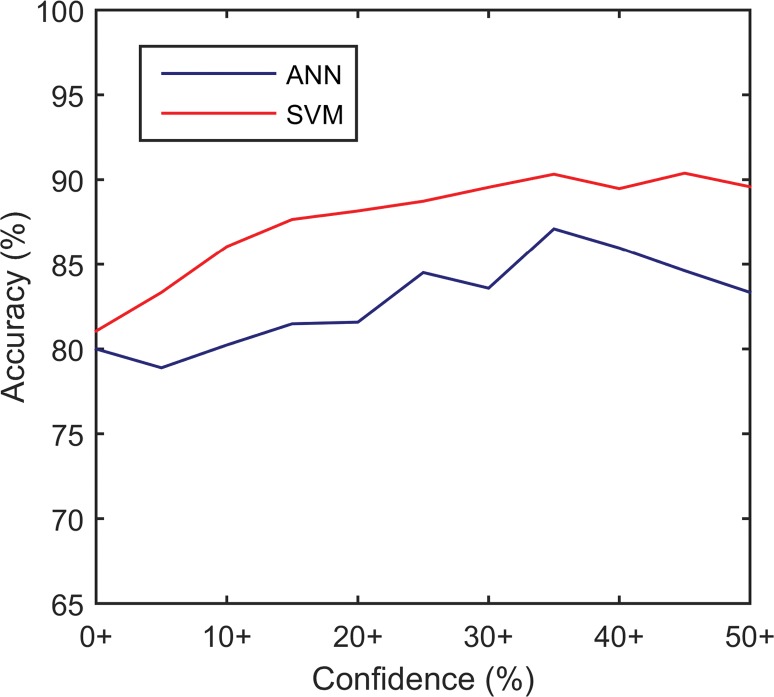
Figure 5a:
Graphs show effect of confidence on diagnostic accuracy for the (a) CAD systems and (b) observers. Accuracy was calculated within subsets containing the labeled confidence level and higher (eg, moderate+ = moderate and high confidence ratings). High-confidence subsets from the CAD classifiers were simulated by removing decision values nearest to the decision boundary. EO = experienced observer, IO = inexperienced observer.

