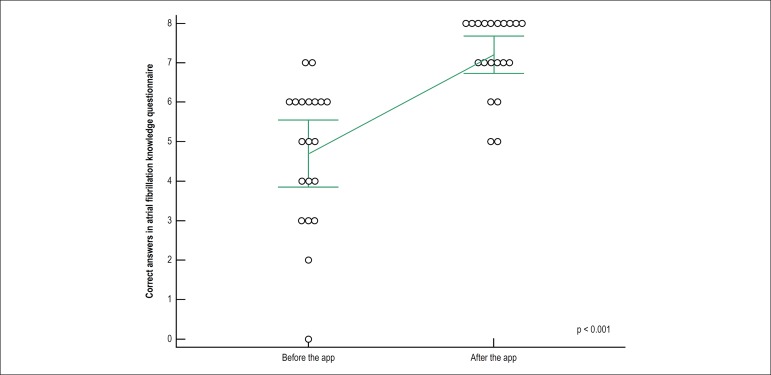
Figure 2.
Mean number of correct answers in the questionnaire about the disease before (4.7) and after (7.2) the intervention, compared by the paired-sample t test, indicating a significant increase in patients’ knowledge after interacting with the application. Error bars indicate standard deviations, and circles represent the score of each patient.

