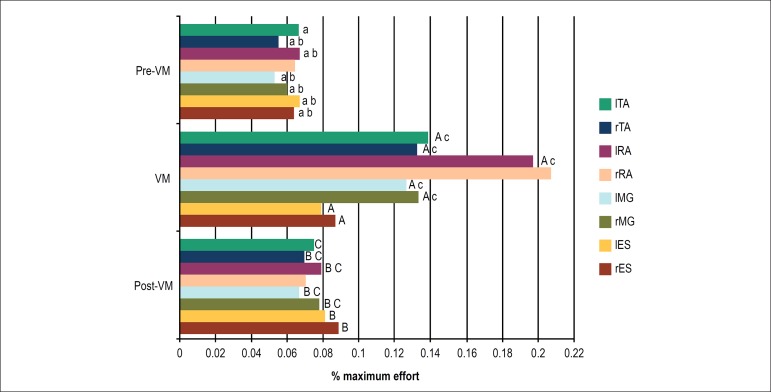
Figure 6.
Percentage of maximum effort in relation to the electromyographic activity recorded during the test divided into three stages: pre-Valsalva maneuver (VM), during the VM and post-VM during the Active Standing Test. A, B, C: significant difference with their corresponding muscles (a,b,c): p < 0.05.

