Fig. 4.
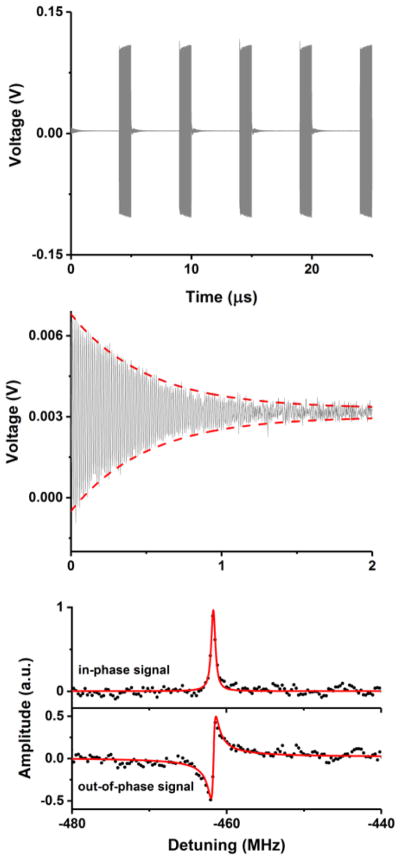
(Upper panel) Time domain self-heterodyne signal for pulsed modulation using the evacuated cell at room temperature. The shown trace is the average of 20 000 acquisitions. The sampling rate was 750 MS/s. An unresolved technical issue leads to a very slight baseline distortion for some of the free induction decays (e.g., the second one). This may be because there are not an integer number of cycles of 461.7 MHz in 5 μs. (Middle panel) Same data as the upper panel but with the x- and y-axes reduced. The gray trace shows the acquired data while the red traces correspond to models of the free induction decay of the form V(t) = Ae−t/(2τ) + V0, where the factor of two in the exponent accounts for the heterodyne nature of the measurement. (Lower panel) In-phase and out-of-phase components of the fast Fourier transform (FFT) of the self-heterodyne signal after a chirped pulse (black points) and corresponding model (solid red line). The x-axis was shifted to account for the AOM offset of 384.22 MHz. Twenty thousand time-domain signals were averaged, with each individual acquisition containing 10 000 samples recorded at 3 GS/s.

