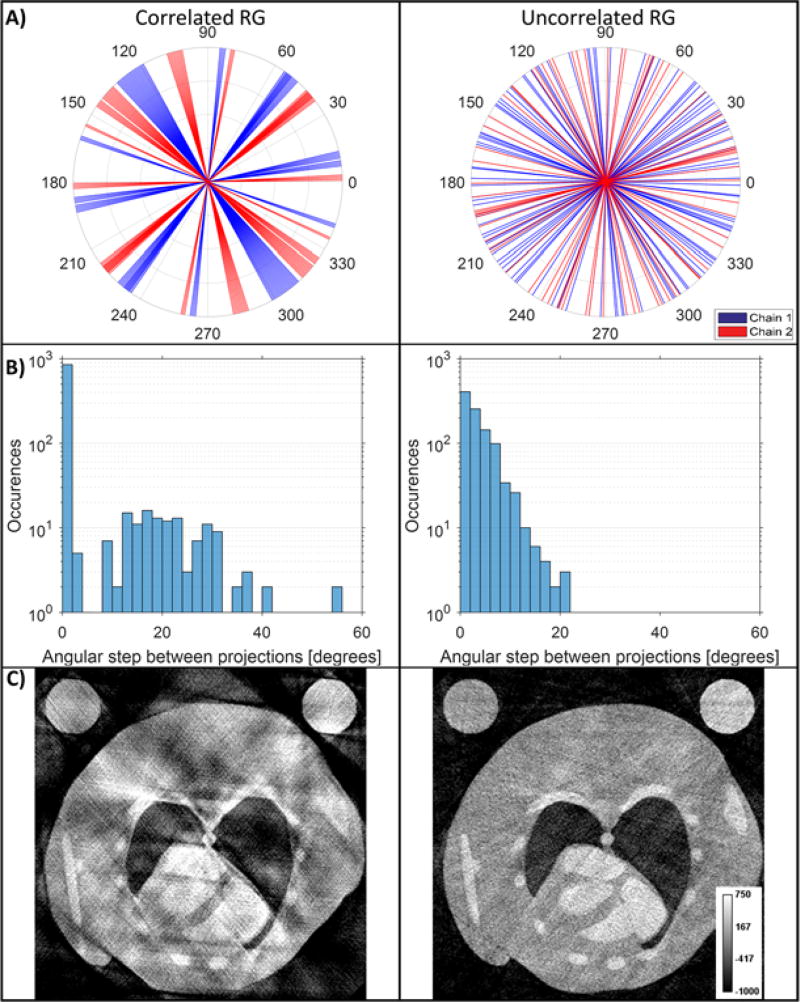
Figure 3.
Comparison of simulated RG with steady sampling that correlates with subject heart rate and randomized sampling which is uncorrelated with heart rate. For each case a total of 1000 projections were used across 10 cardiac phases. A) The number and distribution of projections in correlated and uncorrelated RG for the phase corresponding to 50% R-R. B) Histograms showing the angular spacing between projections in the same phase. The presence of high angular steps indicates gaps in the projection distribution. C) FBP comparisons show how such correlated sampling can negatively affect reconstruction quality.

